


NASDAQ at Bargain Buy Levels or On the Edge of a Crash?
Stock-Markets / Tech Stocks Mar 04, 2008 - 01:46 AM GMTBy: Marty_Chenard

 1. Is the NASDAQ 100 at a great bargain level?
2. Or, is it at the edge of a potentially perilous drop?
To get the answer, we have to look at a "long term", 10 year view of where it is now and how it is performing.
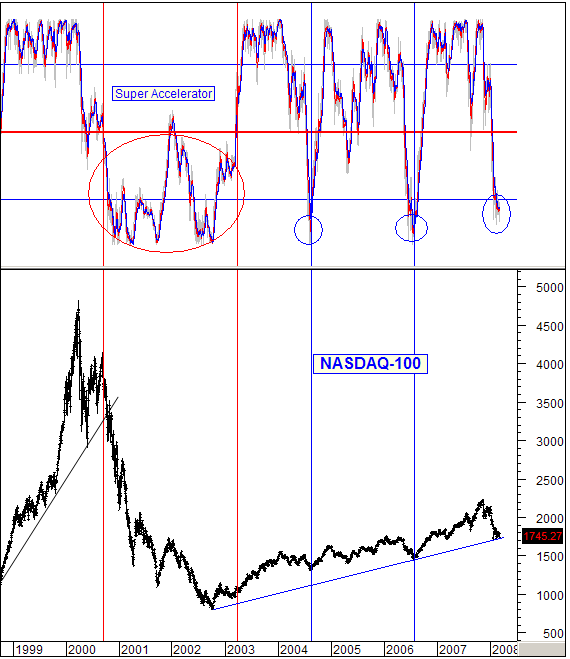
If you look at the chart below, you will see a red horizontal line. This marks the instances where the NASDAQ went into a Bear Market risk environment .
If the Super Accelerator bounces up from the very low levels .... and the index is still above its long term support line , then the bull up trend resumes . This happened in 2004 and 2006 as seen on the chart.
If you look at the 2000 to 2003 period of time, you see that the Super Accelerator dropped below the horizontal red negative line AND the NASDAQ's support line was broken to the downside . Once broken, the Super Accelerator remained negative for the entire Bear market except for one short period of time where the index was still in a down trend because it was making lower highs and lower lows .
Now the big question: Which of these conditions is occurring right now?
The Answer:
1. The Super Accelerator is in negative territory now. Technically, it could move up like in 2004 and 2006 ... or it could remain down for a Bear Market condition. For that condition, we need to look at the long term support line.
2. When we look at the long term support line (2002 to 2008), we see that the NASDAQ 100 is not above the support line ... and it is not below the support line ... it is sitting on the support line .
This is where the BIG test happens NOW ... The line of demarcation of whether or not the NASDAQ 100 falls into a Bear Market condition, or has another Bull move up. The one key factor on this model is whether or not the NASDAQ can now hold its current, long term support line .
This is obviously an important key testing level that will determine whether the NASDAQ will turn into a Bear or Bull condition in the coming days.
(The Super Accelerator model is posted on our paid subscriber site every day.)
My Best, Personal "non-stock" Tip for 2008 ... it will save you from wasting a lot of time , it will eliminate a huge source of frustration , and protect you at the same time.
What is it? See this link for my answer: My 2008 Best Personal Tip .
By Marty Chenard
http://www.stocktiming.com/
Please Note: We do not issue Buy or Sell timing recommendations on these Free daily update pages . I hope you understand, that in fairness, our Buy/Sell recommendations and advanced market Models are only available to our paid subscribers on a password required basis. Membership information
Marty Chenard is the Author and Teacher of two Seminar Courses on "Advanced Technical Analysis Investing", Mr. Chenard has been investing for over 30 years. In 2001 when the NASDAQ dropped 24.5%, his personal investment performance for the year was a gain of 57.428%. He is an Advanced Stock Market Technical Analyst that has developed his own proprietary analytical tools. As a result, he was out of the market two weeks before the 1987 Crash in the most recent Bear Market he faxed his Members in March 2000 telling them all to SELL. He is an advanced technical analyst and not an investment advisor, nor a securities broker.
Marty Chenard Archive |
© 2005-2022 http://www.MarketOracle.co.uk - The Market Oracle is a FREE Daily Financial Markets Analysis & Forecasting online publication.