


Stock Market Uptrend Looks Toppy
Stock-Markets / Stock Markets 2013 Mar 17, 2013 - 05:10 PM GMTBy: Tony_Caldaro

 Another week another bull market high, and the entire range for the week was only about 1%: (SPX 1547-1564). For the week the SPX/DOW gained 0.7%, but the NDX/NAZ were mixed. Asian markets lost 0.7%, European market gained 0.3%, and the DJ World index gained 0.7%. On the economic front, positive reports overwhelmed negative reports. On the uptick: retail sales, export/import prices, business inventories, the CPI/PPI, industrial production, capacity utilization, the NY FED, and the WLEI, plus the budget deficit and weekly jobless claims improved. On the downtick: consumer sentiment and the current account deficit. Next week is FOMC week, and we get a look at housing, plus leading indicators. Best to your week!
LONG TERM: bull market
The market continued to extend this four month uptrend this week. Not only has the DOW reached 300 points above its previous all time high. The SPX is now within 12 points of its all time high. The FED’s QE 1, QE 2 and QE 3 have accomplished their mission: to raise asset prices to support the economy, and avoid a depression. Oddly enough the permabears are still looking, as they have since the year 2000, for a plunge into the abyss. The anticipated plunge, as we have noted over the years, occurred between the years 1929 and 1932. That 89% stock market decline corrected the entire GSC from 1700-1929. In July 1932 a new multi-century GSC (grand supercycle) began.
Grand Supercycles consist of five Supercycle waves. SC 1 rose from July 1932 to Oct 2007. The DOW rose during this period from about 40 to 14,200. Then the bear market from Oct 2007 to March 2009 corrected 54% of that advance to end SC 2. Supercycle wave 3, a multi-decade bull market, began at that time. Supercycle waves consist of five Cycle waves. Cycle wave [1], this bull market, has been underway since the March 2009 low. And, to confirm it presence it has already made all time new highs. When this somewhat short Cycle wave [1] concludes, estimated to top in late winter/early spring of 2014, a nasty, but short bear market should follow. Then the Cycle wave [3] bull market to follow should last two to three decades. There still is plenty of time to get prepared.
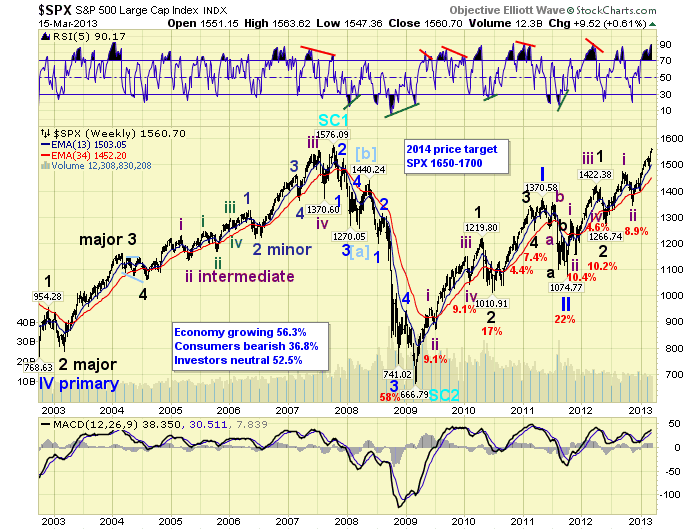
For now Cycle wave [1] continues to unfold as expected. Primary waves I and II, of this five primary wave bull market, ended in 2011. Primary III has been underway since that low. Primary I divided into five Major waves with a subdividing Major wave 1. Primary III is following the same path, but both Major waves 1 and 3 are subdividing into five Intermediate waves. Major waves 1 and 2 completed in mid-2012, Major wave 3 has been underway since that low. When Major wave 3 concludes the market will still have Major waves 4 and 5 to complete Primary III. Then Primary waves IV and V to complete the bull market. Basically there are three more uptrends after this one concludes.
MEDIUM TERM: new uptrend high SPX 1564
The current uptrend, Intermediate wave iii of Major 3, has been underway since mid-November at the SPX 1343 low. During this four month rise the SPX has gained 16.4%, and 221 points. Intermediate wave i, the previous uptrend, lasted four months, gained 16.4% and 208 points. These two uptrends are nearly equal. The previous uptrend subdivided into five Minor waves, with a further subdivision during Minor wave 3. This uptrend is doing exactly the same pattern: five Minor waves with a subdividing Minor wave 3.
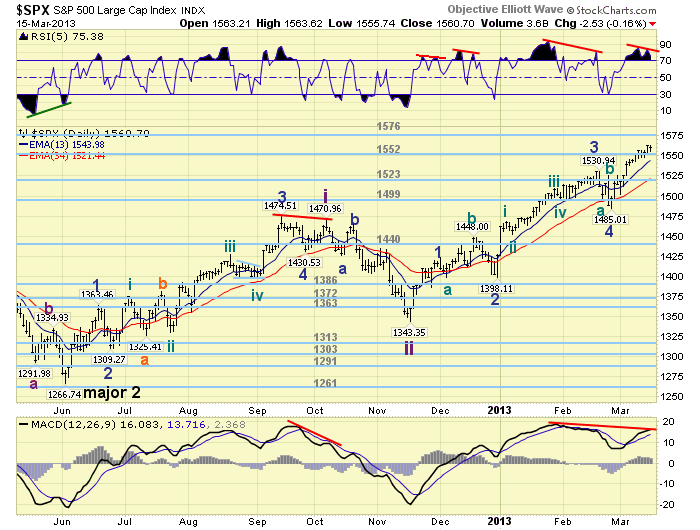
The main difference between Int. i and Int. iii is Minor wave 5. During Int. i, Minor 3 was 1.618 times Minor 1, but Minor 5 truncated, ending with a 0.382 relationship to Minor 1. During Int. iii, Minor 3 also has a 1.618 relationship to Minor 1, but Minor 5 is now within 2 points of equalling Minor 1. No truncation this time. Also of note, during the last uptrend the RSI never signalled a top with a negative divergence. During this uptrend every Minor wave has ended with a negative divergence, including the irregular high for Minute wave b. Observe the negative divergence now.
However, keep in mind this uptrend has cleared our original OEW 1552 pivot target, and is now nearing the 1576 pivot range (SPX 1569-1583). Should it enter that range, and clear it, the next pivot is not until SPX 1614. The technicals: an extremely overbought reading on the weekly RSI, and negative divergences on the daily RSI/MACD, continue to suggest this uptrend is on borrowed time. Also, seven of the nine SPX sectors are displaying negative divergences on their daily charts. However, this is Int. iii of Major 3 of Primary III, theoretically one of the strongest waves of the bull market. Medium term support is at the 1552 and 1523 pivots, with resistance at the 1576 and 1614 pivots.
SHORT TERM
Short term support is at the same 1552 and 1523 pivots, with resistance also at the 1576 and 1614 pivots. Short term momentum ended the week at neutral. The short term OEW charts remain positive with the reversal level at SPX 1550.
This uptrend has been quite relentless in its push for new highs in the SPX, while achieving new highs in the DOW. Our two methods of tracking the short term waves, for Minor 5, suggest a potential uptrend high has occurred or is quite close. And, we have a negative RSI divergence on the hourly chart as well. We looked back at the last two Minor wave 5′s, and neither of them exceeded the length on Minor 1. Friday’s high puts Minor 5 within 2 points of Minor 1.
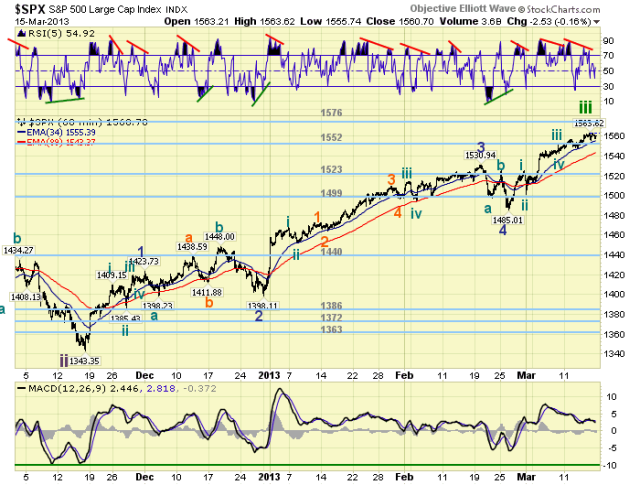
Nevertheless, the market will have to display some downside action before we can be fairly certain the uptrend has ended. The first level of importance is at SPX 1550, then at 1534. A break of the first support would turn our short term charts negative. Then a break of the second level would turn our daily charts negative, implying a correction is underway. Should Intermediate wave iv get underway, we see support just above Minor wave 4 at SPX 1485. This is the 1499 pivot range (SPX 1492-1506). After that the market should rally to new highs for Int. wave v. Best to your trading!
FOREIGN MARKETS
The Asian markets were mostly lower on the week for a net loss of 0.7%. Currently China, Hong Kong, India, Singapore and S. Korea are in downtrends. With India improving.
The European markets were mostly higher on the week for a net gain of 0.3%. Only Greece and Italy remain in downtrends.
The Commodity equity group were mixed on the week for a net loss of 0.8%. Brazil and Russia remain in downtrends.
The DJ World index is still uptrending and gained 0.7% on the week.
COMMODITIES
Bonds are downtrending but gained 0.2% on the week.
Crude is also downtrending but gained 1.7% on the week.
Gold is downtrending as well but gained 0.9% on the week.
The USD is uptrending but lost 0.8% on the week. The downtrending EURUSD gained 0.6%, and JPYUSD gained 0.8%.
NEXT WEEK
Monday kicks off the economic week with the NAHB at 10:00. Tuesday: Housing starts and Building permits. Wednesday: the FED ends its FOMC meeting with a statement and press conference. Thursday: weekly Jobless claims, FHFA housing prices, Existing home sales, the Philly FED, and Leading indicators. Best to your week!
CHARTS: http://stockcharts.com/...
http://caldaroew.spaces.live.com
After about 40 years of investing in the markets one learns that the markets are constantly changing, not only in price, but in what drives the markets. In the 1960s, the Nifty Fifty were the leaders of the stock market. In the 1970s, stock selection using Technical Analysis was important, as the market stayed with a trading range for the entire decade. In the 1980s, the market finally broke out of it doldrums, as the DOW broke through 1100 in 1982, and launched the greatest bull market on record.
Sharing is an important aspect of a life. Over 100 people have joined our group, from all walks of life, covering twenty three countries across the globe. It's been the most fun I have ever had in the market. Sharing uncommon knowledge, with investors. In hope of aiding them in finding their financial independence.
Copyright © 2013 Tony Caldaro - All Rights Reserved Disclaimer: The above is a matter of opinion provided for general information purposes only and is not intended as investment advice. Information and analysis above are derived from sources and utilising methods believed to be reliable, but we cannot accept responsibility for any losses you may incur as a result of this analysis. Individuals should consult with their personal financial advisors.
Tony Caldaro Archive |
© 2005-2022 http://www.MarketOracle.co.uk - The Market Oracle is a FREE Daily Financial Markets Analysis & Forecasting online publication.