


Is Stock Market Minor Wave 4 Really Complete?
Stock-Markets / Stock Markets 2013 Jul 29, 2013 - 12:34 PM GMTBy: Andre_Gratian

 Current Position of the Market
SPX: Very Long-term trend - The very-long-term cycles are in their down phases, and if they make their lows when expected (after this bull market is over), there will be another steep decline into late 2014. However, the severe correction of 2007-2009 may have curtailed the full downward pressure potential of the 40-yr and 120-yr cycles.
Intermediate trend - SPX continues to progress according to its structure. After a brief consolidation, the bull market has resumed its uptrend and has already created new highs in the leading indices.
Analysis of the short-term trend is done on a daily basis with the help of hourly charts. It is an important adjunct to the analysis of daily and weekly charts which discusses the course of longer market trends.
Daily market analysis of the short term trend is reserved for subscribers. If you would like to sign up for a FREE 4-week trial period of daily comments, please let me know at ajg@cybertrails.com
IS MINOR WAVE 4 REALLY COMPLETE?
Market Overview
If it is, it has been a very shallow affair, only retracing to .236 of minor 3. On Friday, in the early part of the day the SPX extended the correction which had started at 1699, then reversed suddenly and continued to rally into the close. It should be noted that IWM was a significant laggard in that rally -- initiated by positive divergence in the SPX hourly indicators but not in those of IWM and QQQ. Of the three indices, only SPX made a new hourly low on Friday, which illustrates the diverse positions of the major indices.
The stock market loves to keep us in a state of indecision, so it is no coincidence that the close took the SPX to the brink of a break-out without confirming it. We'll have to wait until Monday to see if that rally follows through or peters out.
Structure: As mentioned above, it is possible that Friday saw the completion of minor wave 4 and the beginning of minor 5. The corrective structure from 1699 appears to have been a simple a-b-c pattern, but if there is no follow-through on Monday, we could be looking at a more complex correction with a deeper retrace.
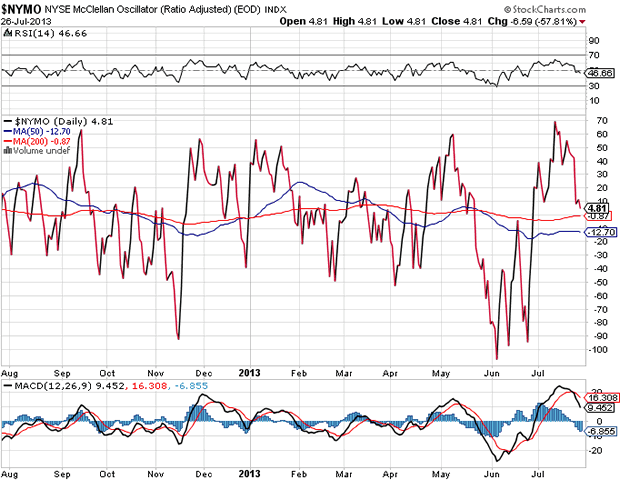
Breadth: The McClellan Oscillator is one of the non-confirming indicators of Friday's move. While prices closed up, the breadth index remained negative and in a downtrend both on the daily and hourly charts.
P&F and Fibonacci projection: The 1692 projection was exceeded by a few points, attesting to the strength of the market. Also, the shallow retracement of .236 of minor 3 may reflect a market which can't wait to make new highs (providing the correction is over).
Support/resistance zones: Main support is at 1672 and the SPX stayed well above it when correcting. With 1690 violated at the last minute on Friday, if there is follow-through 1699 now remains the final challenge before the making of new highs.
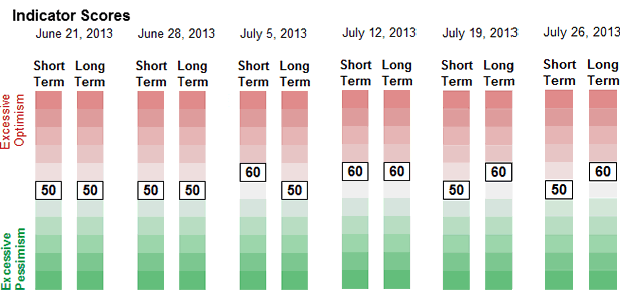
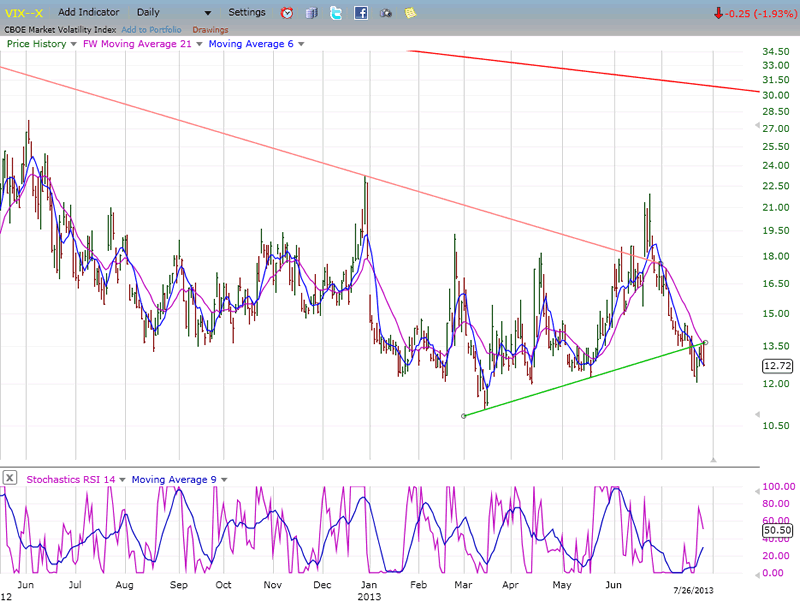
Sentiment: There is no change in the SentimenTrader long term indicator's reading of 60. After making a new low, VIX could not even generate a significant bounce -- a testimony of market strength.
Chart Analysis
The following is a daily chart of the SPX (courtesy of QChart). The main point of this analysis is to determine if, in fact, minor wave 4 bottomed on Friday, or if it still lies ahead of us.
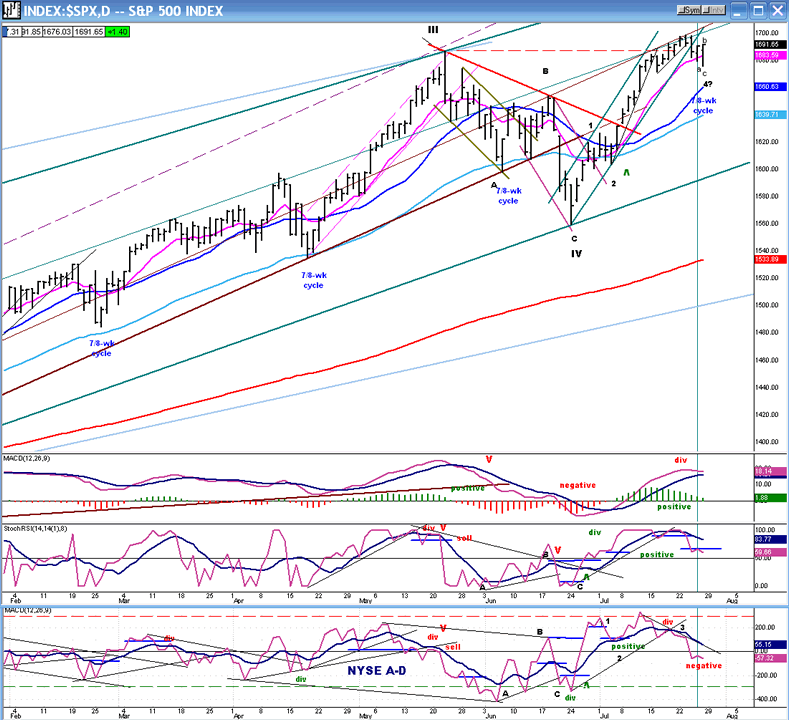
Frankly, there are several things that argue against it and, since Friday's action (although impressive) was inconclusive, any confirmation (or not) should come on Monday. Perhaps the strongest reason for an end to the correction is that the 7/8-wk cycle (which has a fairly regular phase pattern of 34-39 days) appears to have bottomed on Friday, 35 days from its last low. But by itself, this is not enough. We can see that the last time the cycle made its low, it had a 2-day rally followed by another decline. It's possible that we could do something similar, this time.
The other supporting argument is that the price did make a well-defined a-b-c pattern, which is what was required as a minimum for wave 4 to be complete. And, finally, the SPX did break outside of its 1-2-3 channel before moving back up, which is what normally happens.
One of the arguments against the SPX being ready for a resumption of its main uptrend lies in the price action itself. A 4-day pull-back of 23 points seems rather shallow both in price and time for a minor wave 4 pattern. Of course, wave 2 was only 11 points, so wave 4 would be twice as deep, but it still seems like minimal retracement.
Another argument is in the action of the indicators. Neither the SRSI nor the A/D indicator turned up on Friday, remaining in negative divergence to the price. More importantly, in both indicators, the faster MA remained well below the slower one, with the latter still declining. The MACD did not do much one way or the other, but its histogram also declined for the day. What that shows is that the downside momentum of the indicators was not reversed and not even arrested by Friday's 14-point intra-day reversal.
Finally, there is no cohesive action between SPX, IWM and QQQ. They are all in slightly different technical positions.
Neither the pros or the cons are decisive enough to substantiate or nullify a reversal, but more price action will be needed to settle the argument. Most likely, this will come in the form of Wednesday's Fed statement.
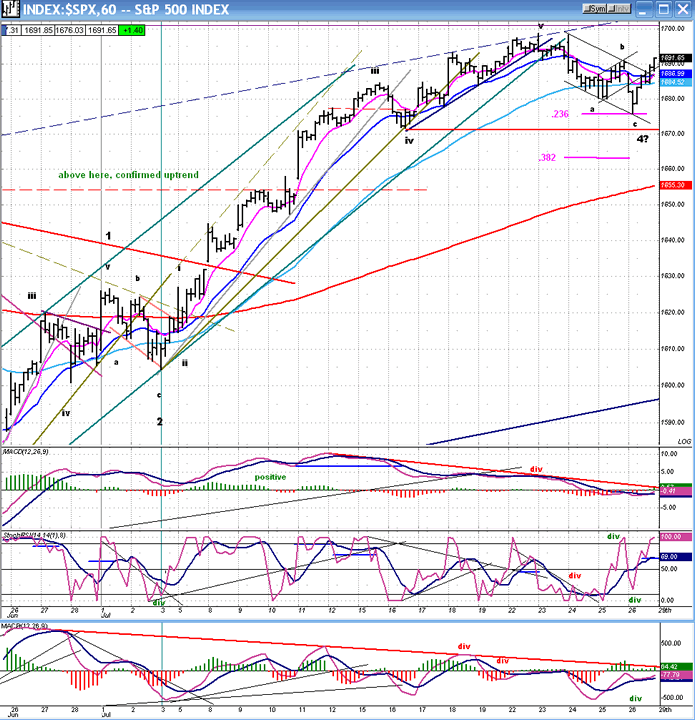
The hourly chart (above) is also unable to convincingly point to the completion of wave 4 and the resumption of the uptrend. The same arguments can be made that have been made about the daily chart. The small downtrend line on the price chart has been broken and the former near-term top slightly surpassed but, for now at least, there is no confirmation from the structure or from the indicators.
The indicators, especially the A/D (lower), lack the upside momentum which is exhibited by the price, and they remain negative and below the red downtrend line. The middle indicator (SRSI) has already reached an overbought level from which it tends to pull back.
The cause of the rally can be seen in the positive divergence which developed in all three indicators when the price made a new near-term low. This condition, however, is confined to the SPX and was not present in IWM or QQQ.
Cycles
From last week: "The 7-8 week cycle may bottom during the week of 7/22, and it could mark the completion of minor wave 4. We are one week closer, so the decline may be over by the end of next week -- unless the cycle extends into an 8th week." Beyond that, the next cycles which could affect the market are due in about a month.
Breadth
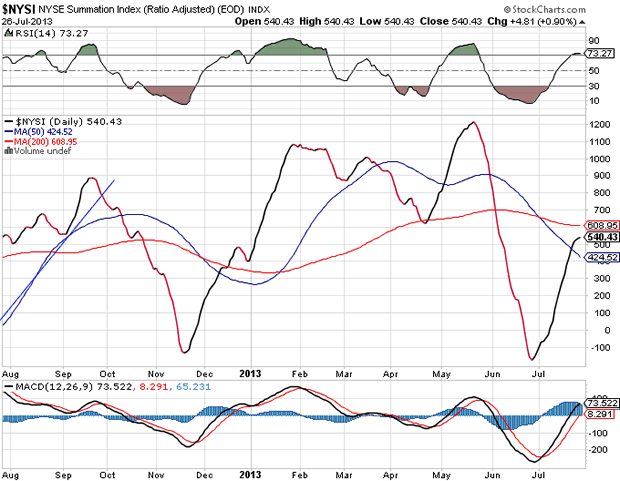
The McClellan Oscillator and Summation Index appear below (courtesy of StockCharts.com).
The McClellan Oscillator has corrected from its overbought condition and retraced to near neutral. Friday's rally has not had any effect on it.
The correction in the NYMO has brought about a pause in the Summation Index, but not yet a reversal. As it does in the SPX, it looks like an interruption of the main trend but it does not tell us for how long.
Sentiment Indicators
The SentimenTrader (courtesy of same) long-term index remains at the same slightly elevated level. It will have to move higher before it signals an important top.
VIX
VIX made another new low last week. It has had a feeble rally in conjunction with a shallow correction in the indices. At this time, it is simply mimicking in reverse what the market is doing - although it is showing long-term positive divergence. When the divergence becomes short-term as well, it will be time to look for a top in the averages. By then, other red flags will begin to appear.
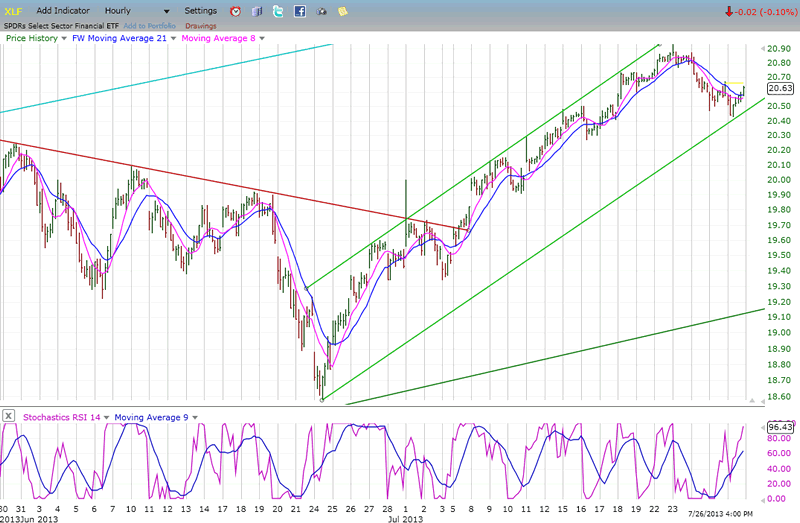
XLF (Financial SPDR)
XLF's action on Friday was not as bullish as that of the SPX. If this short-term divergence persists over the next couple of days, it will be an indication that the correction is not over.
BONDS
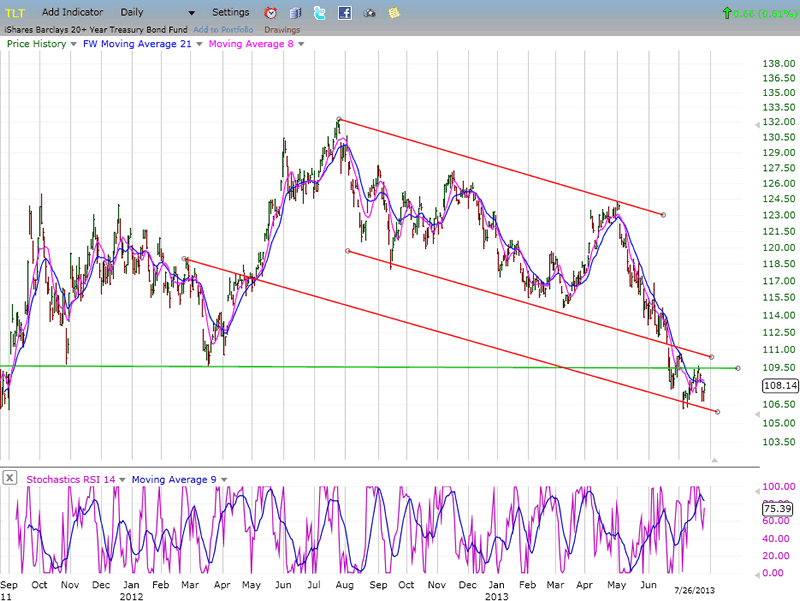
TLT could be starting a consolidation pattern and may be trying to get back above an important support level that has recently been broken. The decline to 107 has satisfied a phase of distribution that was created at the 126 level. That does not mean that it is ready for a significant reversal. It could, instead simply build a re-distribution pattern in the area of its low which can be used to start another down leg in the future. The kind of weakness witnessed in bonds will require the building of a substantial base to turn the long-term trend around. This could still be months away.
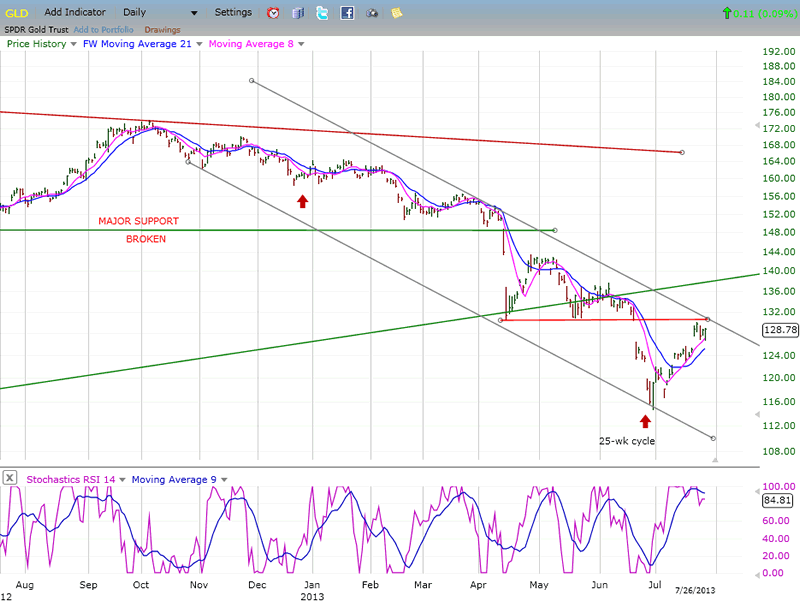
GLD (ETF for gold)
Benefiting from an oversold condition as well as from the bottoming of its 25-wk cycle, GLD has staged a good rally. However, this is likely to be only a rally in a downtrend which may already have run its course. The index faces substantial overhead resistance above the red horizontal line and does not yet have the degree of accumulation necessary to go through it successfully. It also has an unfilled projection to the 110 area which may not be met until the next cycle low. The sharp rise over the past month has caused its momentum indicator to become overbought and makes any future price appreciation doubtful and limited at best.
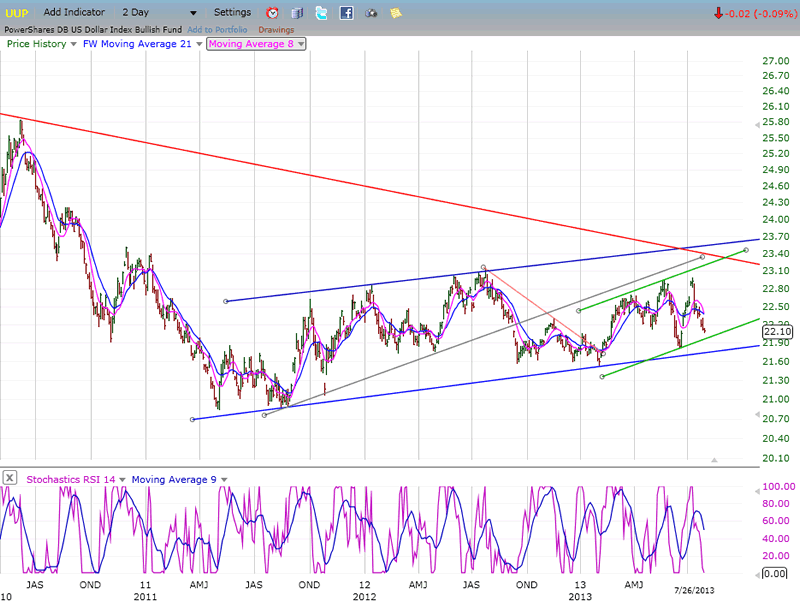
UUP (dollar ETF)
It is unlikely that UUP will do much more than continue its base-building process until there are clear signs that the Fed is about to cut back on its bond purchases. Since that timing is still unclear, it is possible that UUP will be the harbinger of that decision. When UUP begins a steady uptrend and challenges successfully its long-term (red) downtrend line, it will probably signal that QE is coming to an end.
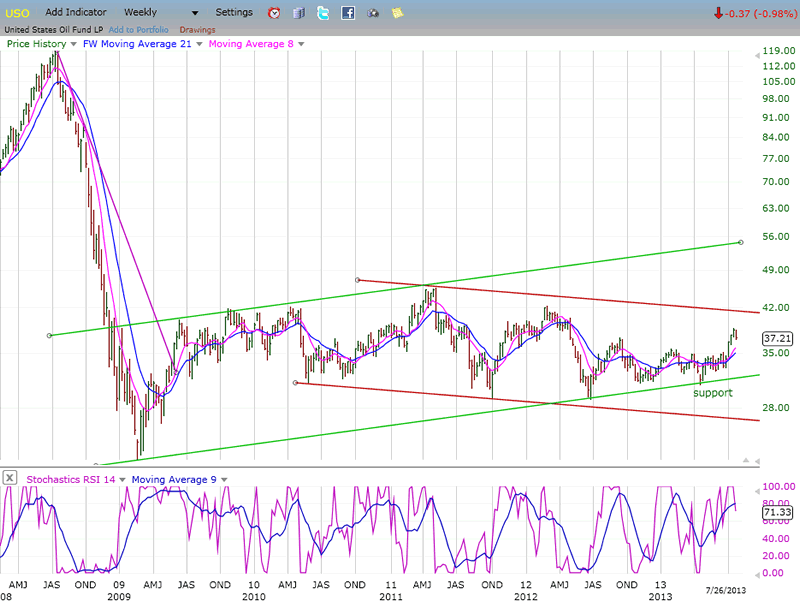
USO (United States Oil Fund)
The base that USO has built over the past year is large enough to support substantially higher prices. Initially, prices should move up to about 41, but that would satisfy only a partial phase count. Trend analysis appears to confirm that potential. A large bullish channel is slowly supplanting the smaller bearish channel which has defined the correction. The total base potential for USO gives it a target of 54 which is at the top of the bullish channel. That should be considered the objective unless the trend clearly changes.
Summary
It is possible that minor wave 4 only brought about a brief and shallow correction, but since there are several areas of non-confirmation, it is best to see what action next week brings to the SPX.
FREE TRIAL SUBSCRIPTON
If precision in market timing for all time framesis something that you find important, you should
Consider taking a trial subscription to my service. It is free, and you will have four weeks to evaluate its worth. It embodies many years of research with the eventual goal of understanding as perfectly as possible how the market functions. I believe that I have achieved this goal.
For a FREE 4-week trial, Send an email to: ajg@cybertrails.com
For further subscription options, payment plans, and for important general information, I encourage
you to visit my website at www.marketurningpoints.com. It contains summaries of my background, my
investment and trading strategies, and my unique method of intra-day communication with
subscribers. I have also started an archive of former newsletters so that you can not only evaluate past performance, but also be aware of the increasing accuracy of forecasts.
Disclaimer - The above comments about the financial markets are based purely on what I consider to be sound technical analysis principles uncompromised by fundamental considerations. They represent my own opinion and are not meant to be construed as trading or investment advice, but are offered as an analytical point of view which might be of interest to those who follow stock market cycles and technical analysis.
Andre Gratian Archive |
© 2005-2022 http://www.MarketOracle.co.uk - The Market Oracle is a FREE Daily Financial Markets Analysis & Forecasting online publication.