


Bad News and the October Stock Market Outlook
Stock-Markets / Stock Markets 2013 Oct 03, 2013 - 07:03 PM GMTBy: Clif_Droke

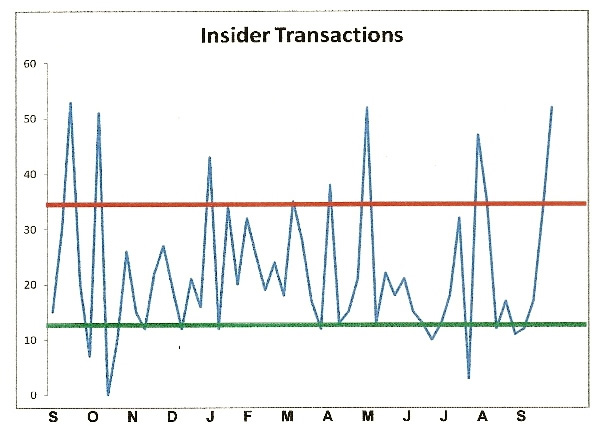
 In recent commentaries we’ve discussed the likelihood of a broad market correction due to a series of divergences among the major averages. The divergence between the Dow and the NASDAQ, for instance, suggests insider distribution. Not surprisingly, insider transactions show that corporate insiders have done more selling of their company’s stock than at any time in several months.
Uncertainty in Washington has also weighed heavily on stocks as investors ponder what effect a continued U.S. government shutdown could have on the economy. Broad market volatility continued to expand as the Volatility Index (VIX) is up 20% this week after closing at a new 3-month high (below). As long as VIX is in this position the stock market will be quite vulnerable to negative news headlines.
Speaking of headlines, in the weeks leading up to the market pullback the news headlines c magazine covers were anything but negative. Optimism bordering on euphoria was reflected on the front covers of several major financial magazines, including Barron’s, Time and Businessweek.
The Sept. 23 issue of Time magazine, for instance, featured another one of those infamous bull market covers. The bull was displayed rather prominently on the cover under the headline, “How Wall Street Won.” Paul Macrae Montgomery, a pioneer of the magazine cover indicator, told Barron’s last month that the Time cover suggested “an 80% chance the market will top in a month and will be lower a year from now.”
The following week Time featured a story with the headline, “Can Google Solve Death?” on its front cover. Google represents one of America’s biggest corporate monoliths, and an article suggesting that even death itself could be conquered by the juggernaut is indicative of excess optimism which is normally seen at market tops. The cover graphic on a recent issue of The Week suggests complacency about the outsized role of Wall Street in the U.S. economy and was also suggestive of a top.
The combined picture presented by these covers is one of investor exuberance – a potentially dangerous state of mind entering a month that historically has seen more than its fair share of volatility. Until we see a return of healthy levels of fear in the headlines and sentiment indicators, investors might consider scaling back on purchases and watching key support levels for potential breaks in October.
Gold
Gold took a beating on Oct. 1, dropping $40/oz. to its lowest settlement in almost two months. Financial media blamed a lack of safe-haven support from investors who expected the U.S. government shutdown to be short lived. Others blamed Japan’s latest commitment to increase its financial stimulus for gold’s decline. Whatever the reason for the sell-off, gold broke a key short-term chart support and is back firmly in the hands of the sellers.
At some point, China’s increasing demand for the yellow metal will likely benefit the gold price and even reverse the 2011-2013 bear market. For now, though, other forces are at work, which supersede the combined power of the Chinese Housewives. Those forces include hedge fund and ETF managers which are more concerned by near-term political and economic considerations in the U.S. First and foremost among these considerations is the looming Congressional showdown over the U.S. debt ceiling and other factors leading to this week’s government shutdown.
As mentioned previously, December gold broke the nearby chart support at the $1,300 level (below). This will invite additional selling from momentum-driven hedge fund and speculators based strictly on technical factors. Gold’s next potential support if the selling deepens is the $1,245-$1,260 area.
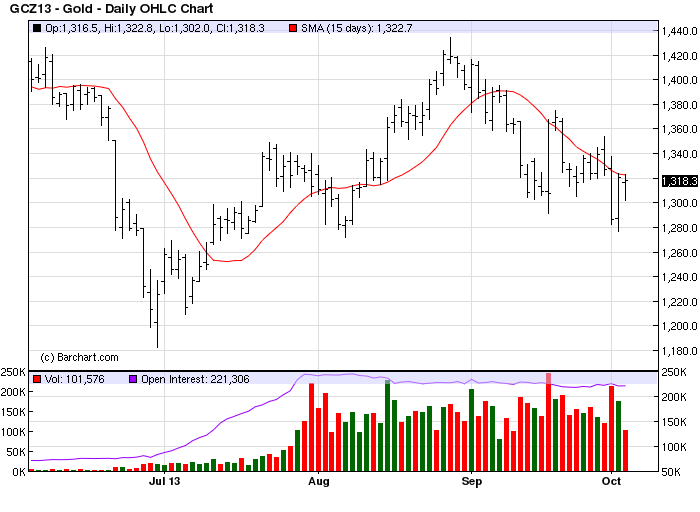
Our indicators – specifically the relative strength indicator – have kept us out of the gold and silver markets in recent weeks as price volatility continues to whipsaw the metals. I’ve continuously advocated for a neutral (i.e. mostly cash) position until the volatility subsides and the metals can overcome and reverse their declining 15-day moving averages. Let’s maintain that strategy for now.
Stock Market Cycles
Take a journey with me as we uncover the yearly Kress cycles - the keys to unlocking long-term stock price movement and economic performance. The book The Stock Market Cycles covers each one of the yearly cycles in the Kress Cycle series, starting with the 2-year cycle and ending with the 120-year Grand Super Cycle.
The book also covers the K Wave and the effects of long-term inflation/deflation that these cycles exert over stock prices and the economy. Each chapter contains illustrations that show exactly how the yearly cycles influenced stock market performance and explains where the peaks and troughs of each cycle are located and how the cycles can predict future market and economic performance. Also described in this original book is how the Kress Cycles influence popular culture and political trends, as well as why wars are started and when they can be expected based on the Kress Cycle time line.
Order today and receive an autographed copy along with a copy of the booklet, "The Best Long-Term Moving Averages." Your order also includes a FREE 1-month trial subscription to the Momentum Strategies Report newsletter: http://clifdroke.com/books/Stock_Market.html
By Clif Droke
www.clifdroke.com
Clif Droke is the editor of the daily Gold & Silver Stock Report. Published daily since 2002, the report provides forecasts and analysis of the leading gold, silver, uranium and energy stocks from a short-term technical standpoint. He is also the author of numerous books, including 'How to Read Chart Patterns for Greater Profits.' For more information visit www.clifdroke.com
Clif Droke Archive |
© 2005-2022 http://www.MarketOracle.co.uk - The Market Oracle is a FREE Daily Financial Markets Analysis & Forecasting online publication.