


Stock Market Correction Still Underway, Next Uptrend Bull Market Top?
Stock-Markets / Stock Markets 2013 Oct 07, 2013 - 03:02 PM GMTBy: Andre_Gratian

 Current Position of the Market
SPX: Very Long-term trend - The very-long-term cycles are in their down phases, and if they make their lows when expected (after this bull market is over), there will be another steep decline into late 2014. However, the severe correction of 2007-2009 may have curtailed the full downward pressure potential of the 40-yr and 120-yr cycles.
Intermediate trend - SPX made an intermediate high at 1730 and is now in a corrective mode.
Analysis of the short-term trend is done on a daily basis with the help of hourly charts. It is an important adjunct to the analysis of daily and weekly charts which discusses the course of longer market trends.
CORRECTION STILL UNDERWAY NEXT UPTREND = BULL MARKET TOP?
Market Overview
The correction which started at SPX 1730 is still underway, but it probably reached the approximate mid-point of its correction on Thursday with the low of the 8-wk cycle. This would be the A wave of the corrective pattern with B now in an uptrend. The up-leg of the correction (B) has already retraced nearly .382 of the distance from the top. If it were to retrace 50%, this would take it to about 1700 and .618, to 1797. One should watch the market action closely to see at which level it stops rallying and starts on the C wave.
The dichotomy between the various indices continues with the Dow Jones Industrial still being the weakest of the lot. The Russell 2000 and NASDAQ 100 are clearly the strongest, but the latter appears to be in a final blow-off stage. SPX is somewhere in the middle, being restrained by weakness in the Dow and the slowing momentum of the financial index which failed to make a new high in September.
The patterns that are being made by the SPX and the NASDAQ 100 are strongly suggestive of a bull market top. That would fit in with the long-term cycles which are due to make their lows about a year from now. The market structure also suggests that an important pattern is being completed. We should know in a few weeks if this bull market, which has lasted four and a half years, is about to give up the ghost.
Chart Analysis
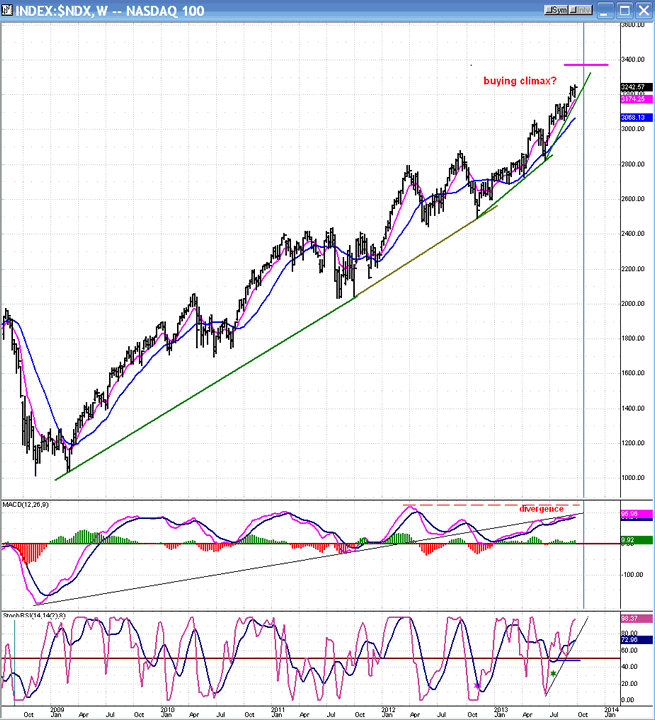
The buying climax which appears on the NDX 100 chart is best seen on the weekly chart. It is not nearly as severe as the one which occurred going into the March 2000 top, but it does have some of the same characteristics: a move which starts accelerating upward after a long uptrend. The NASDAQ 100 bull market started almost five years ago and the price started accelerating after the October 2012 low. Based on a Fibonacci projection, I have marked where I believe the index will make its final high.
Note that in spite of the strong price uptrend, the MACD has not been able to rise above the high of May 2011. When the index finally makes its high, this oscillator should collapse and go negative in a matter of weeks, if not days.
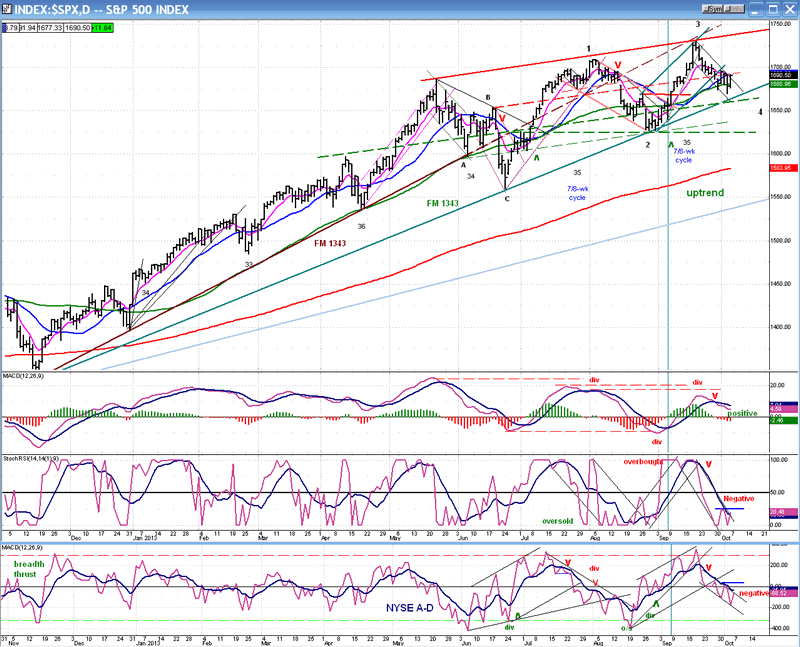
While the terminal pattern of the NASDAQ 100 shows up best on a weekly chart, the SPX pattern -- which is the exact opposite - can best be seen on a daily chart. (I discussed this in the last newsletter.) SPX, which is now in wave 4, is probably making an ending triangle and has a little longer to go. Then wave 5 should make a new high -- perhaps penetrating the top trend line before completing. This should be followed by a reversal which will mark the start of the next bear market.
I went through extensive analysis of this chart, last week, so I won't repeat it except to say that also, in the case of the SPX, the MACD gives us the best indication that we are making a major top. Since May, while the index was making higher and higher highs, the MACD made lower and lower tops. It is likely that the same pattern will occur in the final wave.
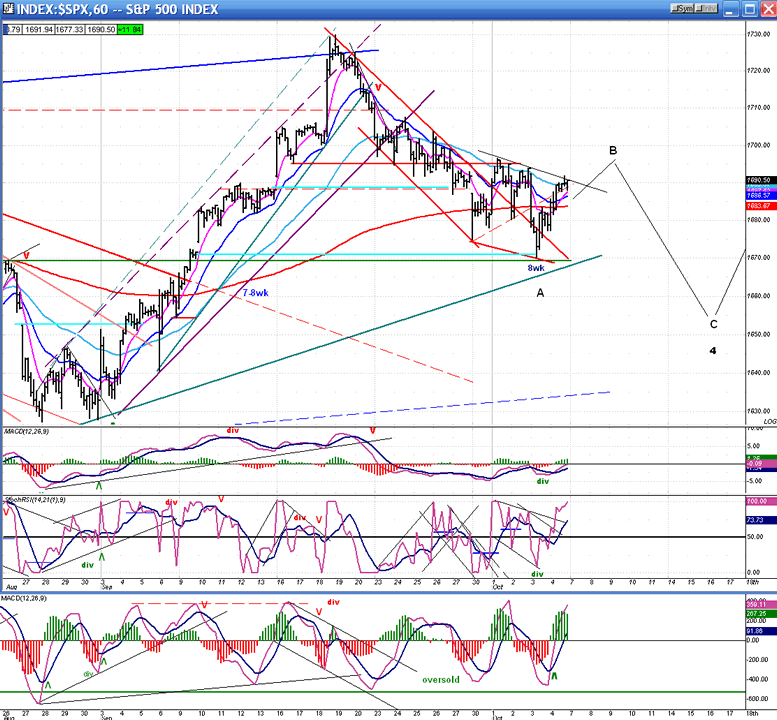
As for the short-term trend, we can best see what is taking place on the hourly chart.
Shaped primarily by the short-term cycles, SPX is most likely making a corrective pattern in the form of an A-B-C with a good possibility that wave A was completed on Thursday at the low of the 8-wk cycle, and B will be formed by the rising phase of that cycle. But it should be short-lived because the 18-wk cycle -- due after the middle of the month -- should soon overwhelm it as it exerts downward pressure into its low creating wave C.
The low point of A is best seen in the MACD which showed some positive divergence at the final downtick. By Friday's close, SPX had already retraced .382 of its decline from 1730, and this could satisfy the minimum requirement for wave B. But since none of the oscillators appear ready to give a sell signal, it is more likely that we'll reach about 1700 (a .50 retracement) before putting an end to it. Two of the three hourly oscillators are overbought and may need to pull back a little before the final push takes place.
Cycles
Last week, the 8-wk cycle (which consists of two 4-wk cycles) made its low and started a bounce (which will probably turn out to be limited in scope) followed by another low caused by the 18-wk cycle as it bottoms after the middle of the month.
Breadth
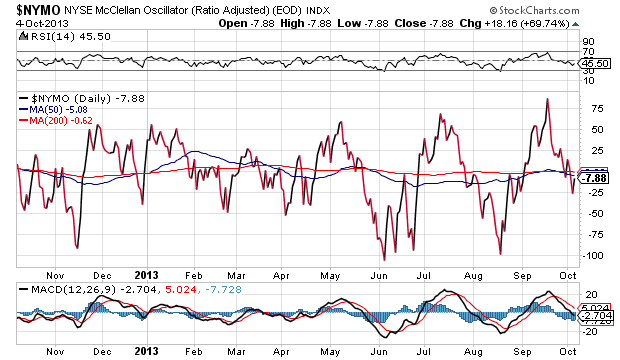
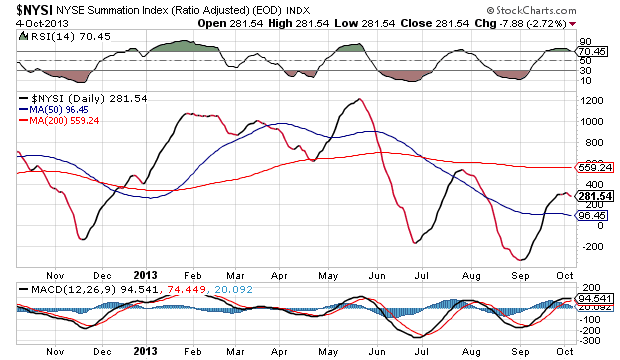
The McClellan Oscillator and Summation Index appear below (courtesy of StockCharts.com).
The McClellan Oscillator has now entirely corrected its overbought condition and dropped slightly into negative territory. If my analysis is correct, it should now rally into the B wave and then drop even lower to complete the C wave.
NYSI has begun to roll over, but should attempt to rally a little as NYMO rallies. NYSI is still making a weak pattern which is not likely to become much stronger if we are in the final throes of the bull market.
Sentiment Indicators
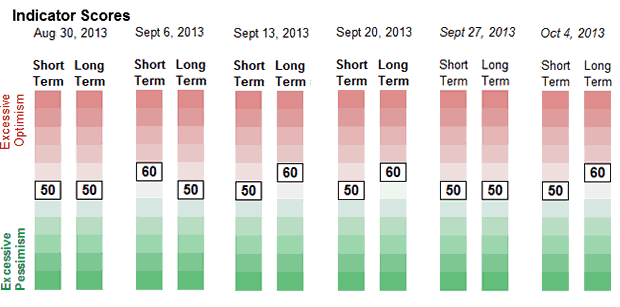
The SentimenTrader (courtesy of same) long-term indicator score has ticked back up to 60 in spite of the market correction. This has no immediate significance.
VIX
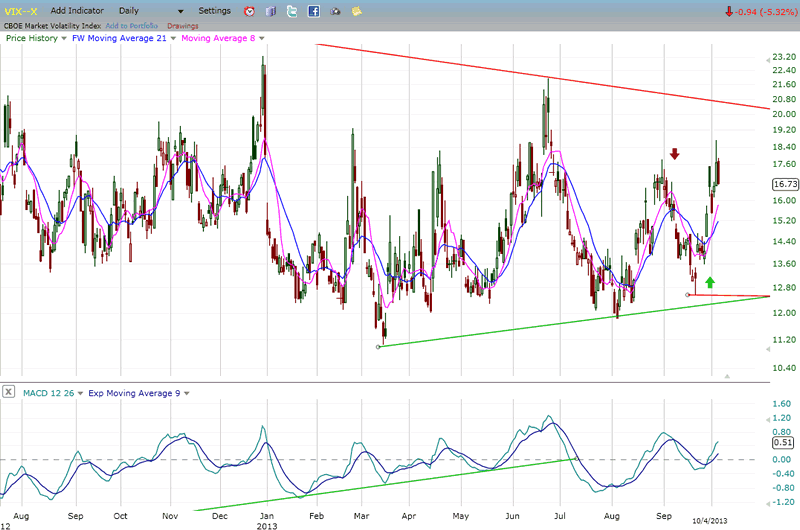
Last week, VIX made another short-term high, rising approximately 1 point higher than the previous one. While it may correct slightly as SPX finishes its B wave correction, it is likely that it will continue to move up -- perhaps toward the top of the long-term trend line - by the time the C wave is completed.
It is also very likely that it will remain above its recent lows when the SPX makes its final high, thereby holding on to the divergence which has characterized its action since the March low. This protracted relative strength in the VIX is another indication that the market is coming to the end of its bull run. At the very least it suggests that an important top is being formed.
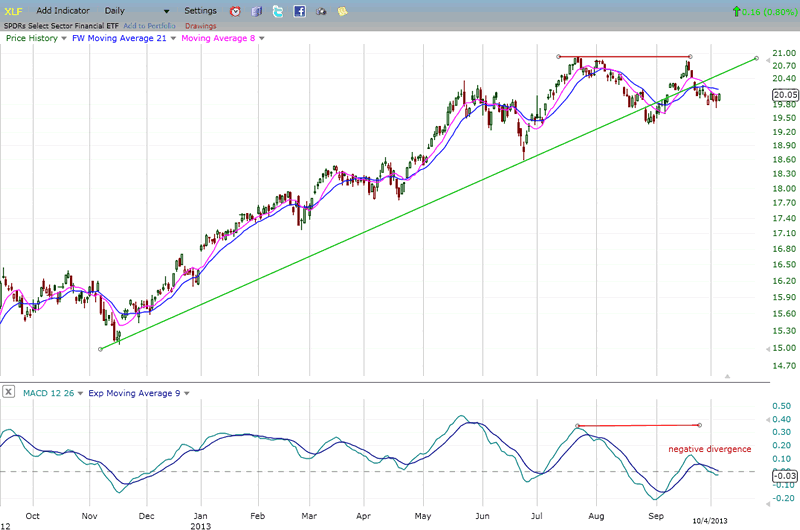
XLF (Financial Index)
XLF is losing relative strength to the SPX. It has failed to make a new high in conjunction with SPX and has already broken its comparative trend line while SPX is still trading above. The financial index is in the habit of underperforming SPX at important tops.
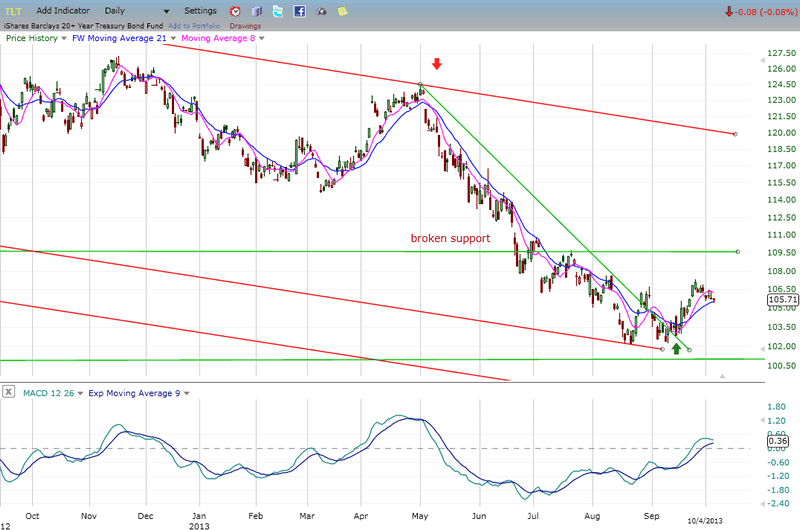
BONDS
TLT Has made a temporary bottom but there is nothing in its long-term indicators that suggests that it is ready for anything more than a consolidation in a downtrend which may see a rally to the broken support line before resuming its decline.
GLD (ETF for gold)
GLD had its first significant rally within its long-term downtrend and may be preparing to extend it by a few more points. The first rally was stopped by minor overhead resistance. If SPX resumes its short-term uptrend and is able to overcome it, it will run into something even more significant in the 144-148 area. It is unlikely that it could make any headway beyond that level before more serious accumulation takes place above its previous low. A clean break out of the red channel will be required before we can entertain the possibility that GLD has finally put an end to its long-term correction.

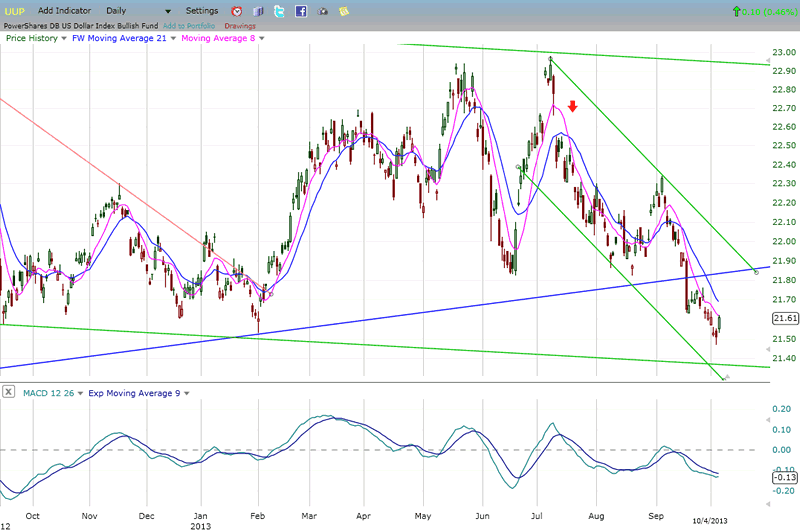
UUP (dollar ETF)
UUP may be reaching the low point of its downtrend from 22.90. Some deceleration is becoming evident on the MACD, and even some positive divergence with the June low is beginning to appear in that indicator. UUP is also near the bottom of its large corrective channel from which it could attempt another rally to the top over a period of several weeks. UUP should start to rally when, or slightly before, the Fed begins to taper its bond purchase program.
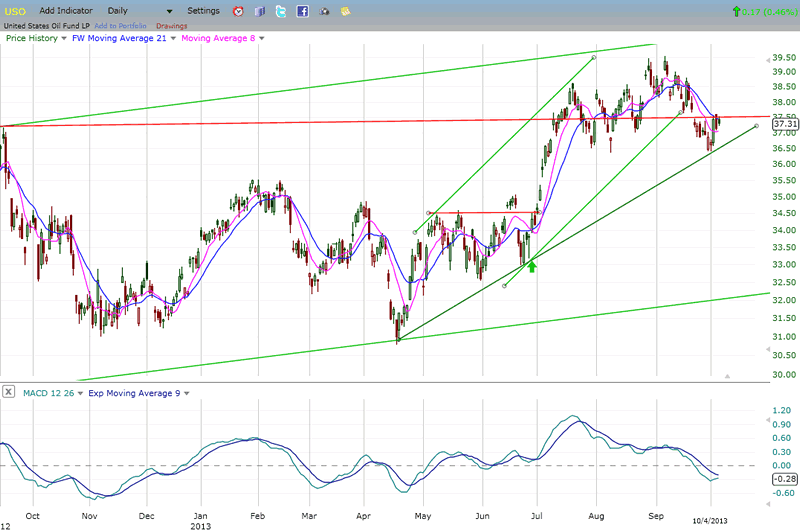
USO (United States Oil Fund)
USO corrected its short-term uptrend to the level of its trend line, which corresponds to the former near-term lows. It should attempt to resume its uptrend after the SPX finishes its correction; perhaps reaching the top of its green channel where it is likely to find more resistance.
Summary
SPX is approximately half-way through an intermediate correction which could last past the middle of the month, after which it should reach the final top of the bull market which started in March 2009. There are a number of market patterns, divergences, and sentiment indications which strongly suggest that the four and a half-year bull market is ready to transition into a bear phase.
Of course, if there is no resolution to the Washington crisis before October 17, there is a good possibility that the bull market top is already in place.
FREE TRIAL SUBSCRIPTON
If precision in market timing for all time framesis something that you find important, you should
Consider taking a trial subscription to my service. It is free, and you will have four weeks to evaluate its worth. It embodies many years of research with the eventual goal of understanding as perfectly as possible how the market functions. I believe that I have achieved this goal.
For a FREE 4-week trial, Send an email to: ajg@cybertrails.com
For further subscription options, payment plans, and for important general information, I encourage
you to visit my website at www.marketurningpoints.com. It contains summaries of my background, my
investment and trading strategies, and my unique method of intra-day communication with
subscribers. I have also started an archive of former newsletters so that you can not only evaluate past performance, but also be aware of the increasing accuracy of forecasts.
Disclaimer - The above comments about the financial markets are based purely on what I consider to be sound technical analysis principles uncompromised by fundamental considerations. They represent my own opinion and are not meant to be construed as trading or investment advice, but are offered as an analytical point of view which might be of interest to those who follow stock market cycles and technical analysis.
Andre Gratian Archive |
© 2005-2022 http://www.MarketOracle.co.uk - The Market Oracle is a FREE Daily Financial Markets Analysis & Forecasting online publication.