


Stocks Bull Market Continues
Stock-Markets / Stock Markets 2013 Nov 09, 2013 - 03:46 PM GMTBy: Tony_Caldaro

 After a rally Monday, pullback Tuesday, the market rallied back to the SPX 1775 all time high Thursday morning. Then the market had its biggest one day reversal in quite a while hitting SPX 1746 just before the close. Friday, however, the market completely reversed recovering all of Thursday’s loss ending the week at SPX 1771. For the week the SPX/DOW were +0.70%, the NDX/NAZ were -0.25%, and the DJ World index lost 0.4%. On the economic front nearly all the reports were positive. On the uptick: factory orders, leading indicators, ISM services, Q3 GDP, consumer credit, nonfarm payrolls, personal income/spending, PCE prices, the M1 multiplier, the WLEI and weekly jobless claims declined. On the downtick: consumer sentiment and the unemployment rate rose. Next week we get reports Industrial production, the twin deficits and the NY FED.
LONG TERM: bull market continues
We continue to count this bull market as Cycle wave [1] consisting of five Primary waves. Primary waves I and II completed in 2011, and Primary wave III has been underway since that low. Primary I divided into five Major waves and so has Primary III. A couple of times over the past two months it appeared that Primary III had ended. The market is in Major wave 5, the last wave of Primary III, and fifth waves have been weak in this bull market. We have been erring on the side of caution. But this bull market has been resilient and ended the week only four points from its all time high.
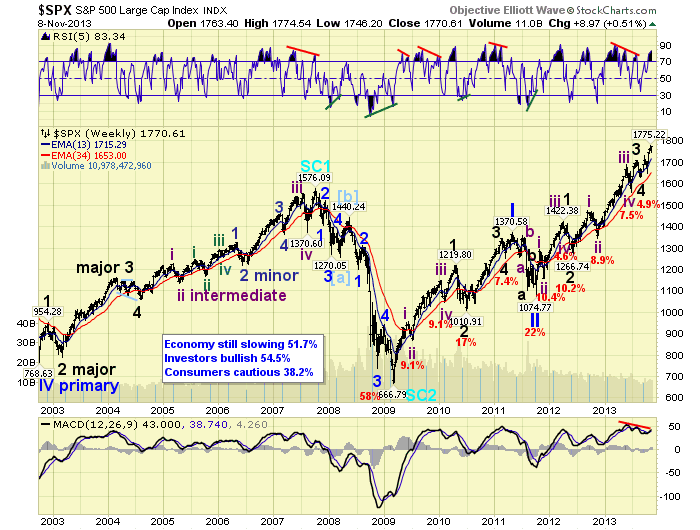
We had been projecting all along a bull market high around SPX 1780 by early 2014. The market entered that range in late October, retested it Thursday, and now appears to be heading back into that range. This price activity, obviously, is months ahead of schedule. With the SPX and DOW counts out of sync, as they have been since August, making a new projection, at this time, would only be guess work. When these two indices re-sync, which should be during Primary IV, we will get a better idea of where this bull market should end in price.
MEDIUM TERM: uptrend
We have been tracking this uptrend, Major wave 5 from the August low at SPX 1627, as five Intermediate waves. At first we thought they could form an ending diagonal triangle so we labeled the rallies/declines with both numbers and letters. This week Int. wave iv appears to have bottomed at SPX 1746, not overlapping Int. wave i at SPX 1730, and the diagonal triangle is now off the table. This uptrend appears to have completed four Int. waves SPX: 1730-1647-1775-1746, with the fifth wave underway.
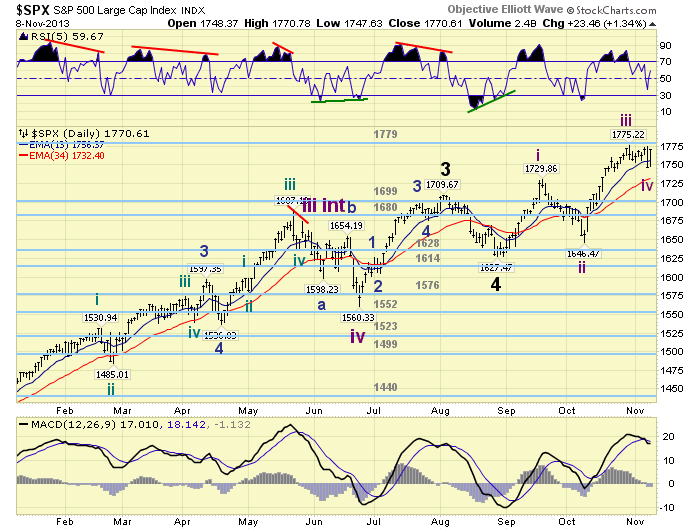
Normally we would expect this fifth wave to have some Fibonacci relationship to either waves 1, 3 or both. However, the SPX has had a few fifth waves failures over the past year or so. So Friday’s close at SPX 1771 could have been it. If it isn’t, and the SPX clears the OEW 1779 pivot range, then the next resistance would be at SPX 1810 and SPX 1826-1828. The first two numbers are 0.618 relationships to Intermediate waves i and iii, with the last number a Fibonacci relationship for Major waves of the entire Primary III. Medium term support is at the 1699 and 1680 pivots, with resistance at the 1779 and 1828 pivots.
SHORT TERM
We counted five Minor waves up from SPX 1627-1730 for Int. wave i. After a steep and complex pullback for Int. ii to SPX 1646. We then counted another five Minor waves up to SPX 1775 for Int. wave iii. Intermediate wave iv was much shorter in time and price, as has been the case for fourth waves during this bull market. But it did drop into the upper end of the price range we expected and then the market rallied strongly on Friday. Intermediate wave v appeared clearly underway on Friday.
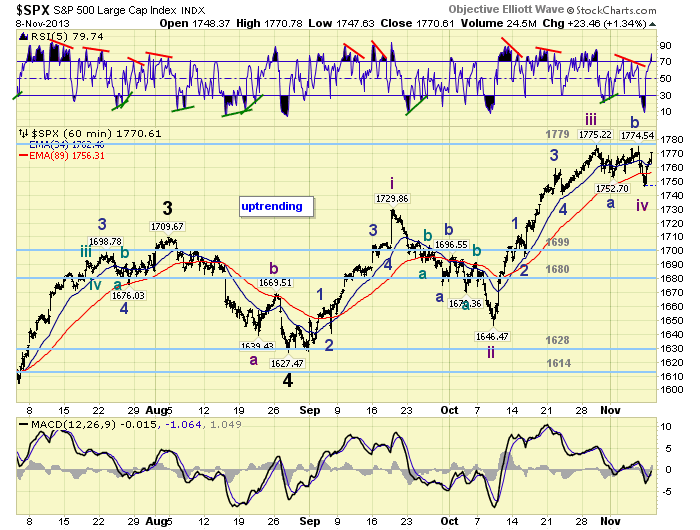
Short term support is at SPX 1746 and 1730, with resistance at the 1779 pivot and SPX 1810. Short term momentum ended the week quite overbought. The short term OEW charts are positive again with the reversal level at SPX 1762. Best to your trading the recent stop and go action!
FOREIGN MARKETS
The Asian markets were mostly lower on the week losing 0.8%. China, Hong Kong, Indonesia, Japan, Singapore and S. Korea are all in confirmed downtrends.
The European markets were mostly lower as well, but only lost 0.4%.
The Commodity equity group were mixed on the week losing 1.9%. Brazil is in a confirmed downtrend.
The DJ World index is still uptrending but lost 0.4% on the week. Of the 20 world indices we track 35% are in confirmed downtrends.
COMMODITIES
Bonds have not confirmed a downtrend yet, losing 0.4% on the week, but 10YR rates have confirmed an uptrend.
Crude is still downtrending and lost 0.3% on the week.
Gold may be in an unconfirmed uptrend, but it lost 2.0% on the week.
The USD is uptrending again gaining 0.7% on the week.
NEXT WEEK
Wednesday: Export/Import prices and the Budget deficit. Thursday: weekly Jobless claims and the Trade deficit. Friday: the NY FED, Industrial production and Wholesale inventories. Also on Thursday: FED vice chair Yellen testifies before the Senate in a confirmation hearing. Best to your weekend and week!
CHARTS: http://stockcharts.com/public/1269446/tenpp
http://caldaroew.spaces.live.com
After about 40 years of investing in the markets one learns that the markets are constantly changing, not only in price, but in what drives the markets. In the 1960s, the Nifty Fifty were the leaders of the stock market. In the 1970s, stock selection using Technical Analysis was important, as the market stayed with a trading range for the entire decade. In the 1980s, the market finally broke out of it doldrums, as the DOW broke through 1100 in 1982, and launched the greatest bull market on record.
Sharing is an important aspect of a life. Over 100 people have joined our group, from all walks of life, covering twenty three countries across the globe. It's been the most fun I have ever had in the market. Sharing uncommon knowledge, with investors. In hope of aiding them in finding their financial independence.
Copyright © 2013 Tony Caldaro - All Rights Reserved Disclaimer: The above is a matter of opinion provided for general information purposes only and is not intended as investment advice. Information and analysis above are derived from sources and utilising methods believed to be reliable, but we cannot accept responsibility for any losses you may incur as a result of this analysis. Individuals should consult with their personal financial advisors.
Tony Caldaro Archive |
© 2005-2022 http://www.MarketOracle.co.uk - The Market Oracle is a FREE Daily Financial Markets Analysis & Forecasting online publication.