


Gold Improving Bullish Sentiment, Could Witness Stock Market Bloodbath
Stock-Markets / Financial Markets 2014 Jan 27, 2014 - 05:22 AM GMTBy: Clive_Maund

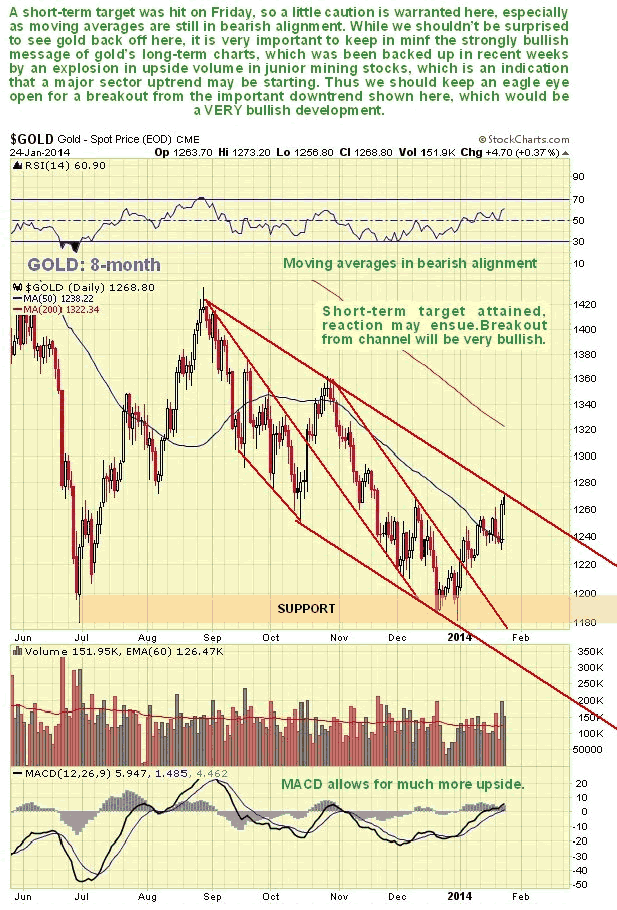
 Gold's technical picture has improved since the last bullish update just over a month ago, but it has still not broken out the intermediate downtrend that started back last August, which we can see drawn on the 8-month chart shown below.
On Friday the gold price arrived at a short-term target at the upper boundary of the downtrend, which is a good point for it to turn down again, especially as its moving averages are still in bearish alignment, and world markets have started to tank, which was predicted on the 2nd January on the site in the article, more about which later. If it does turn down again shortly bulls will want to see continued basing action above its lows of last June and July, and December leading to an upside breakout from this downtrend.
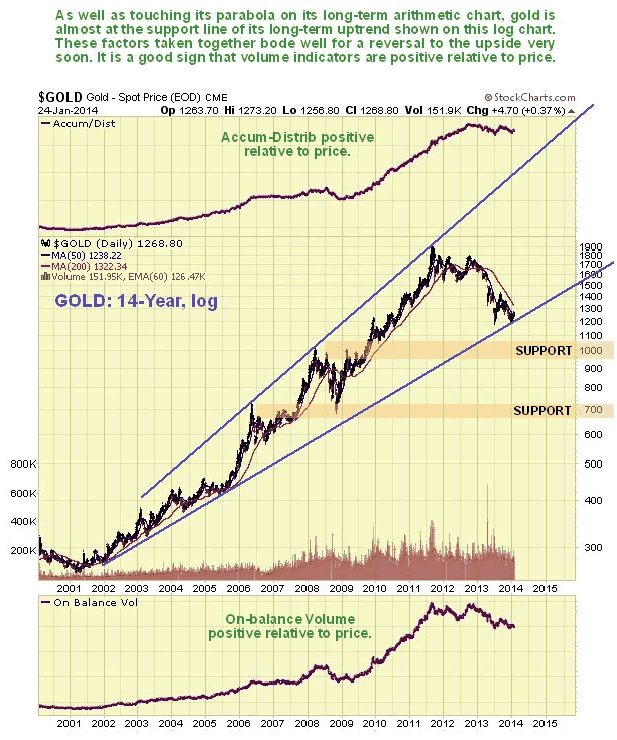
The longer-term picture for gold continues to look promising. On its 14-year log chart we can see that it is close to the lower boundary of the major uptrend in force from 2001. This is a supremely important uptrend as it has supported gold's price throughout its bullmarket, even including the time when it plunged in 2008 at the time of the market crash, when it didn't even reach it. While it is expected to stay within this uptrend it is clear that if it should fail the price would probably drop immediately to the strong support level in the $1000 area.
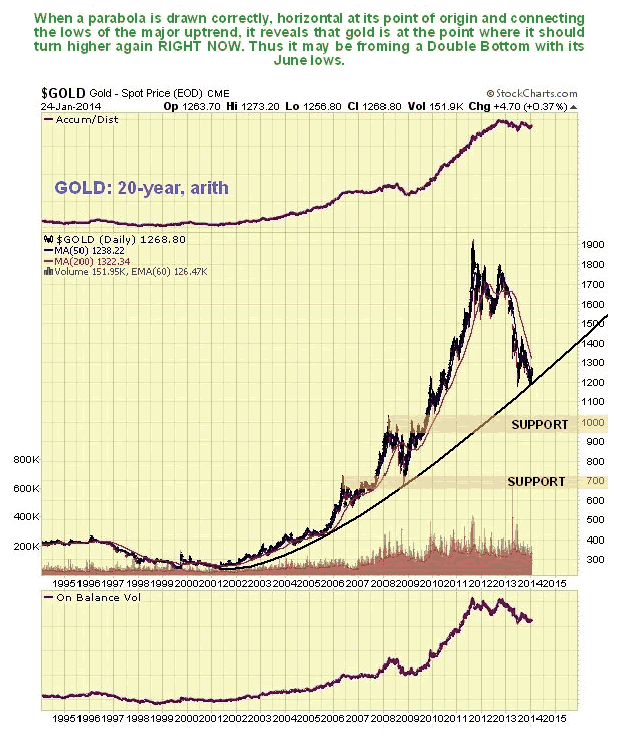
The 20-year arithmetic chart for gold underlines the importance of its not breaking down below recent lows, as in addition to being at the supporting long-term trendline shown on its 14-year log chart, gold is at a supporting long-term parabolic trendline, whose origins lie at the 2001, and failure of both of these will mean that it is no longer in a bullmarket, even being as generous as possible.
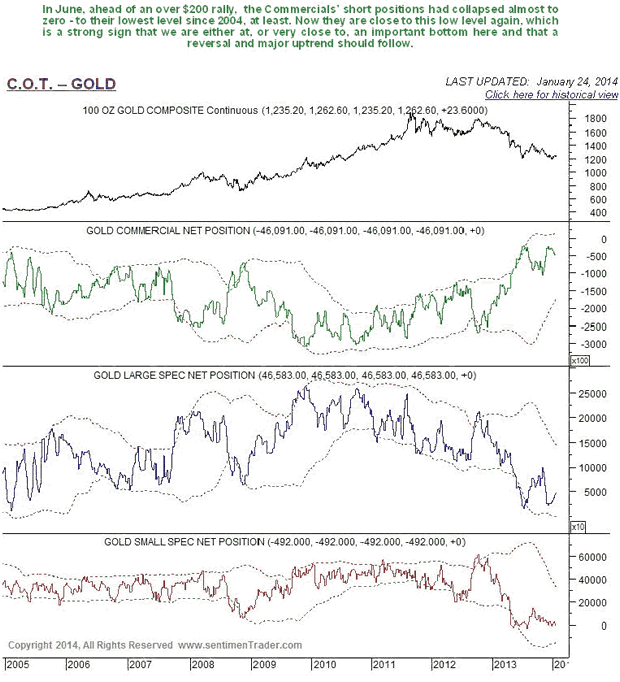
Gold's latest COT continues to look strongly bullish, with Commercial short positions continuing to be near record lows, despite a slight increase in recent weeks as the price has recovered. This supports our contention that gold is bottoming here.
Public opinion towards gold is still at a very low level consistent with the metal being at a cyclical low, and provides another indication that it is bottoming.

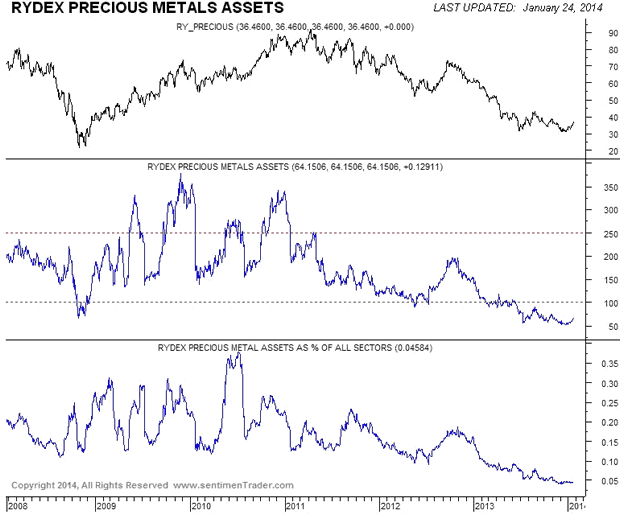
Although Rydex Precious Metals assets have picked up in recent weeks as gold has recovered, they have been lifting off abysmally low readings. This is another sign that gold is bottoming, because the Rydex traders are notorious for being on the wrong side of the trade, so much so that they can be described as having turned it into an art form. Their minimal interest in the sector bodes very well indeed.
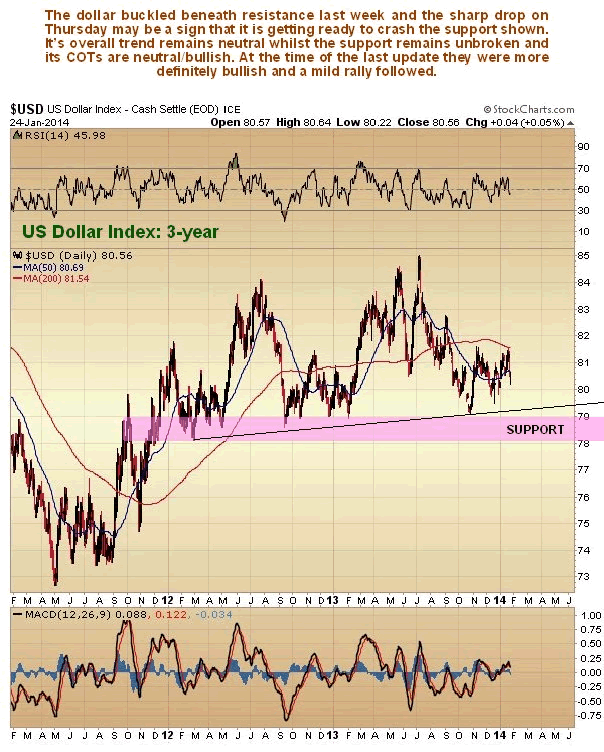
We were rather bullish on the dollar index in the last update, partly due to its positive COT, and it did rally into early last week, but then it dropped hard on Thursday, and its COT picture has weakened to more neutral. Although the overall trend of the dollar remains neutral whilst it is in the range 78 - 85, Thursday's sharp drop may presage failure of the important support level shown on the 6-month chart shown below. If this support did fail it would help to levitate the gold price.
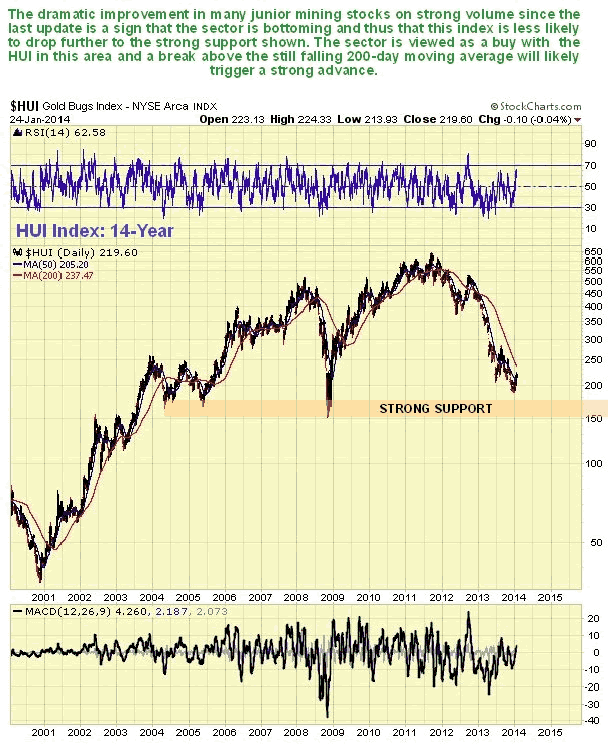
In the last update we were of the opinion that the HUI index might drop a little more before a final bottom is reached, to the strong support level shown on its 14-year chart below, and it still might, given that that it is still below its falling 200-day moving average. That didn't stop us buying a range of quality juniors like Minco Gold and Richmont Mines, however, because they were so cheap late last month that they were irresistible, especially as the juniors as a group were showing signs of turning up.
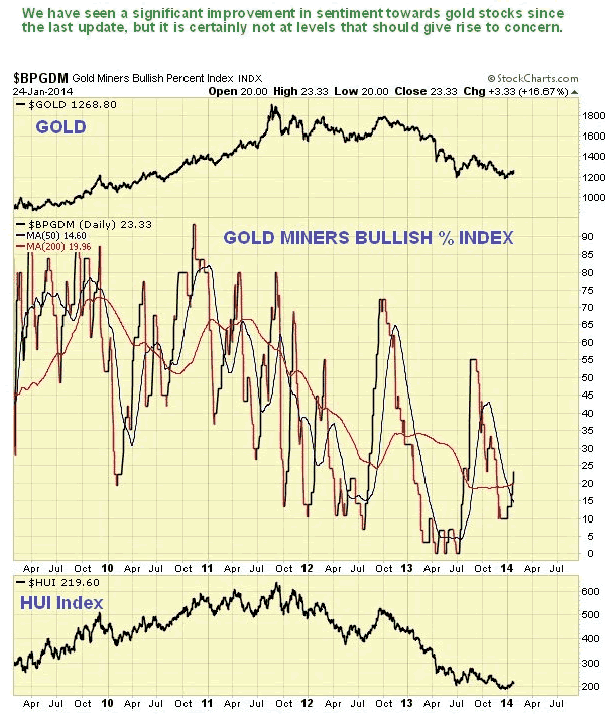
Sentiment towards gold stocks has improved significantly in recent weeks, but certainly not enough to give rise to concern for bulls, as the following chart makes plain.
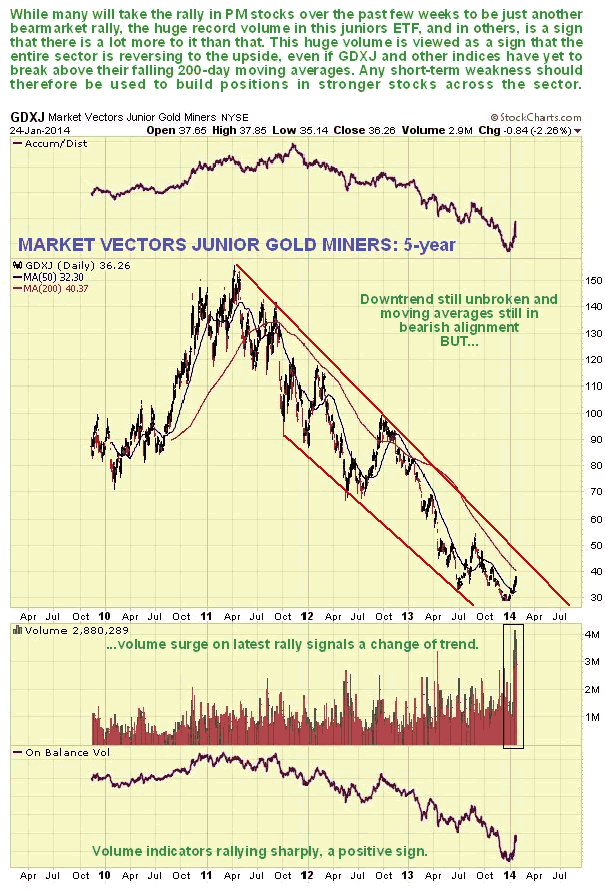
One interesting development in recent weeks has been the volume surge in juniors on the rally. They rose on record volume. This is viewed as very bullish, as a sign that the sector is indeed reversing to the upside. We can see this volume surge on the 5-year chart for the GDXJ shown below, and how it has driven up its volume indicators. So while many observers are probably yawning disdainfully and dismissing the runup in PM stocks over the past few weeks as "just another bearmarket rally" this high volume suggests that it is anything but, and that we are witnessing the birth of a new bullmarket. What if the broad market tanks, won't that stop it? - probably not. After all, PM stocks dropped while the broad market rose, so why shouldn't they rise when the broad market falls? (sometimes this work can be so simple). Our tactics therefore are to seize on any short-term dip to load up on the best PM stocks.
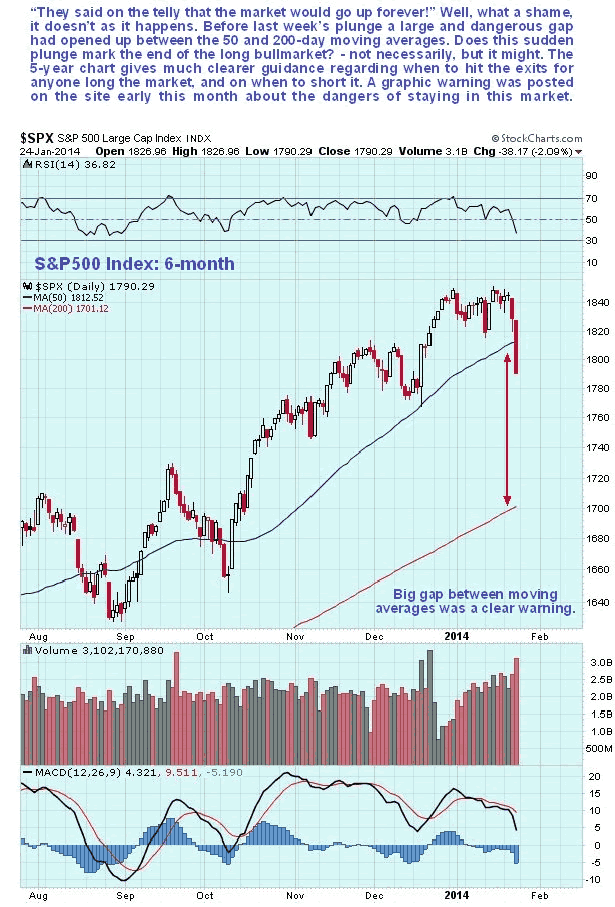
There was a vicious plunge in US (and other) stock indices late last week, especially on Friday. This came as no surprise to us with the clearest possible warning being posted on the site on the 2nd of this month in BROAD US MARKET update - NO NEW PARADIGM - GET OUT NOW!! Could this be the start of a major panic selloff? - it could, especially given the almost universal bullishness that is at large in the world now.
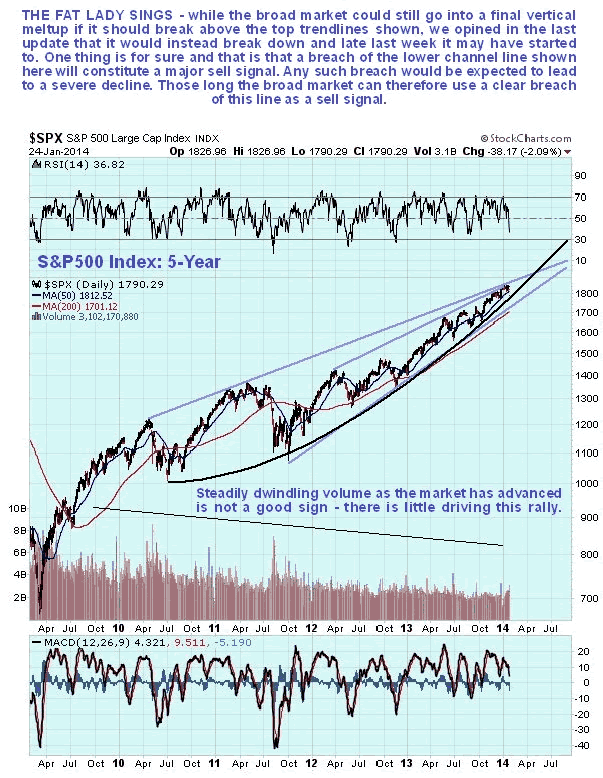
Our guide for a more definite indication that the wheel is coming off the broad market is the lower blue trendline shown on our 5-year chart for the S&P500 index below - if the market makes a significant breach of this supporting trendline we could see an absolute bloodbath that would quickly go global.
By Clive Maund
CliveMaund.com
For billing & subscription questions: subscriptions@clivemaund.com
© 2013 Clive Maund - The above represents the opinion and analysis of Mr. Maund, based on data available to him, at the time of writing. Mr. Maunds opinions are his own, and are not a recommendation or an offer to buy or sell securities. No responsibility can be accepted for losses that may result as a consequence of trading on the basis of this analysis.
Mr. Maund is an independent analyst who receives no compensation of any kind from any groups, individuals or corporations mentioned in his reports. As trading and investing in any financial markets may involve serious risk of loss, Mr. Maund recommends that you consult with a qualified investment advisor, one licensed by appropriate regulatory agencies in your legal jurisdiction and do your own due diligence and research when making any kind of a transaction with financial ramifications.
Clive Maund Archive |
© 2005-2022 http://www.MarketOracle.co.uk - The Market Oracle is a FREE Daily Financial Markets Analysis & Forecasting online publication.