


Dow Stocks Bull Market Continues
Stock-Markets / Stock Markets 2014 Feb 09, 2014 - 10:17 AM GMTBy: Tony_Caldaro

 Another wild week volatile week that started off quite choppy to the downside. Then ended with a strong rally to the upside. After closing last week at SPX 1783, the market dropped to 1738 by Wednesday morning. Next it rallied, over the next two days, to end the week at SPX 1797. For the week the SPX/DOW were +0.7%, the NDX/NAZ were +0.8%, and the DJ World index gained 0.7%. Economic reports for the week were slightly to the downside: 7 to 6. On the uptick: construction spending, ISM services, monthly payrolls, consumer credit, plus both the unemployment rate and weekly jobless claims improved. On the downtick: ISM manufacturing, monthly auto sales, factory orders, the ADP index, the WLEI, the monetary base, and the trade deficit worsened. Next week we get a look at Industrial production and Retail sales.
LONG TERM: bull market
We continue to count this bull market as Cycle wave [1] of Super cycle wave 3. Cycle wave bull markets unfold in five Primary waves. Primary waves I and II completed in 2011. Primary III has been underway since then, and may have topped in January. Primary I divided into five Major waves with a subdividing Major wave 1. Primary III has also divided into five Major waves, but both Major waves 1 and 3 subdivided. The recent uptrend high at SPX 1851 could have ended all of Major wave 5, therefore completing Primary III. Or, it could have only ended Intermediate wave one as Major wave 5 also subdivides.
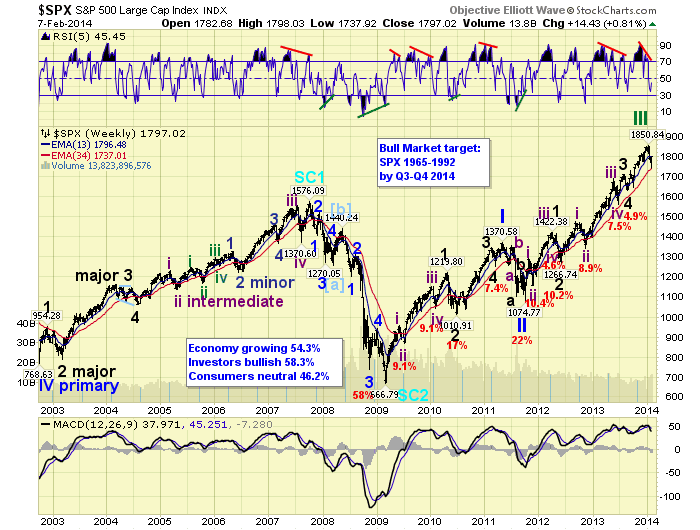
As noted last week, two potential outcomes were, and still are, possible. If Major wave 5 ended at SPX 1851, then a 3-5 month Primary IV correction would be underway. This would probably unfold in three trends/waves, as the market loses 15% to 20% of its value. If Intermediate wave one of Major 5 ended, then a 1-2 month correction would be underway. This would probably unfold in one trend/wave, and the market would likely lose a lesser 8% to 9% of its value. Regardless of the outcome the bull market is still unfolding.
MEDIUM TERM: downtrend
After the recent uptrend topped at SPX 1851 the market started to pullback, and a downtrend was confirmed not too long after. We counted five waves down to SPX 1770/1771, and we labeled that wave a. The rally that followed was a one day affair to SPX 1799, and we labeled that wave b. Then there was another five wave decline to SPX 1738 this Wednesday, and we counted that as wave c/A to complete a zigzag. Next we expected a rally into the SPX 1790′s to complete a larger B wave. This unfolded by Friday, as the SPX hit 1798. Normally, we would expect this B wave to top between a 50% and 61.8% retracement, or SPX 1795 to 1808. Next, after this B wave concludes, we would expect another decline, possibly another zigzag, to put in a more substantial low.
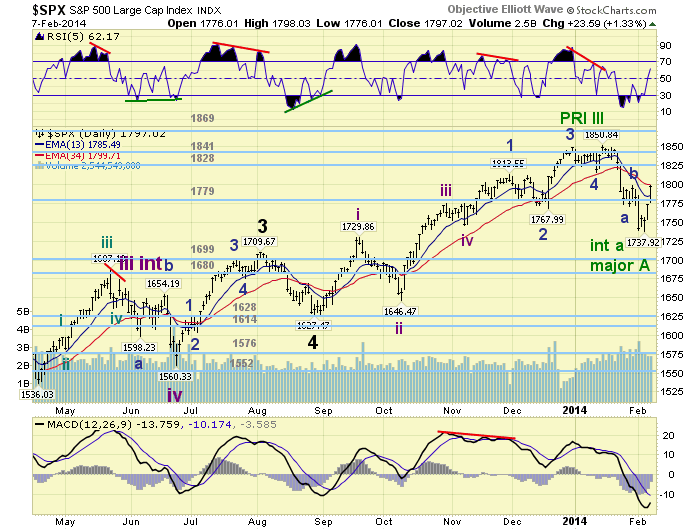
On the SPX charts we have labeled the potential Primary wave III top scenario. Under this scenario the recent low is labeled Intermediate wave a, with a Minor a-b-c decline, and Int. wave b underway. On the DOW charts we have labeled the potential Intermediate wave one scenario. Under this scenario the recent low is labeled Minor wave a, with a Minute a-b-c decline, and Minor b underway. Normally after the current rally completes, we would expect the next series of lower lows to end either SPX Major wave A, or DOW Intermediate wave two.
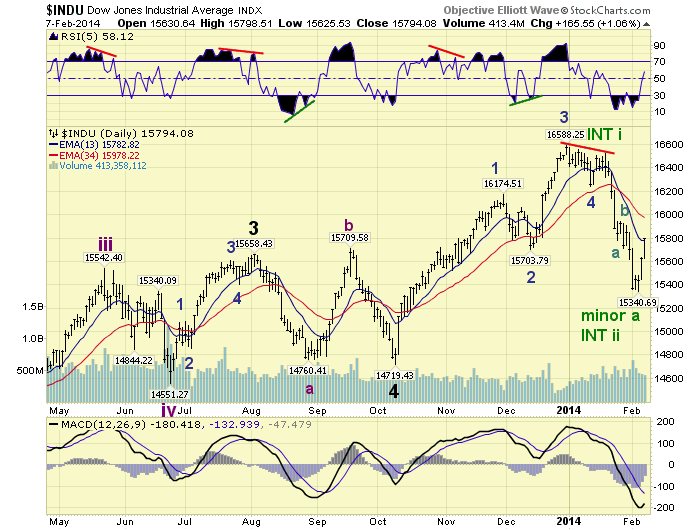
The SPX scenario suggests the market would drop about 15% to 20%, and not make new highs for several months, while Major waves B and C complete. The DOW scenario suggests, new highs would immediately follow after the next decline ends. Medium term support is at the 1779 and 1699 pivots, with resistance at the 1828 and 1840 pivots.
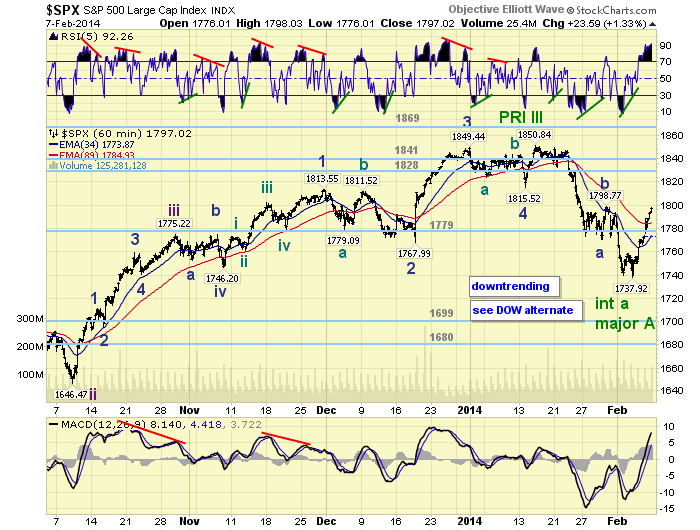
SHORT TERM
Short term support is at the 1779 pivot and SPX 1768, with resistance at SPX 1800 and SPX 1814. Short term momentum ended the week extremely overbought. The short term OEW charts remain positive with the reversal level SPX 1774.
While the market has been generally tracking the two scenarios we have been expecting. There have been a few notable quirks along the way. On Wednesday the market made a quick, 10 minute reversal, on its way to SPX 1738. This threw us a curve for a bit. But at the close the zigzag low looked like it had ended at SPX 1738. The next quirky observation occurred between that low and Friday’s high. The market rallied into the SPX 1790′s fine. But it only has one notable pullback along the way: 1788-1777 on Friday. This is quite unusual for an expected B wave, even of this degree. Normally they are clearly a lot choppier, with overlapping waves.
As a result of this impulsive activity, we did a very short term momentum analysis for the entire bull market. What we found is that these types of upward surges have most often been kickoffs to new uptrends during this bull market. The exception being the B wave during the Major 2 correction in 2010. For now, we are using the SPX 1814 resistance level, which is above the 1808 61.8% retracement, to signal if a new uptrend may be underway. This has two possibilities as well. We are being objective: project, monitor and adjust when necessary.
Should SPX 1814 be exceeded, and a new uptrend may be underway. For the SPX count this would suggest Major wave A has ended, Major wave B is underway, and the labeling would have to be upgraded one level. For the DOW count this would suggest Intermediate wave two has ended, Intermediate three is underway, and not only would the labeling have to be upgraded one level, but the market is heading to new highs. In effect, we are now dealing with three variables heading into next week. If it all sound quite confusing just remember, regardless of the outcome, we are still in a bull market. For now we are leaving the labeling as it pending further market data, especially SPX 1814.
FOREIGN MARKETS
The Asian markets were mostly lower on the week for a net loss of 0.6%.
The European markets were nearly all higher on the week for a net gain of 1.6%.
The Commodity equity group were all higher on the week for a net gain of 1.5%.
The DJ World index gained 0.7% on the week.
COMMODITIES
Bonds remain in an uptrend and gained 0.1% on the week.
Crude confirmed an uptrend and gained 2.8% on the week.
Gold is in a choppy uptrend and gained 1.8% on the week.
The USD is close to confirming a downtrend and lost 0.8% on the week.
NEXT WEEK
Tuesday: Wholesale inventories. Wednesday: Treasury budget. Thursday: weekly Jobless claims, Retail sales and Business inventories. Friday: Export/Import prices, Industrial production and Consumer sentiment. As for the new FED. Tuesday: FED chair Yellen gives Congressional testimony on the Semiannual Monetary policy report. Thursday: Fed chair Yellen gives similar testimony to the Senate. Best to your weekend and week!
CHARTS: http://stockcharts.com/public/1269446/tenpp
http://caldaroew.spaces.live.com
After about 40 years of investing in the markets one learns that the markets are constantly changing, not only in price, but in what drives the markets. In the 1960s, the Nifty Fifty were the leaders of the stock market. In the 1970s, stock selection using Technical Analysis was important, as the market stayed with a trading range for the entire decade. In the 1980s, the market finally broke out of it doldrums, as the DOW broke through 1100 in 1982, and launched the greatest bull market on record.
Sharing is an important aspect of a life. Over 100 people have joined our group, from all walks of life, covering twenty three countries across the globe. It's been the most fun I have ever had in the market. Sharing uncommon knowledge, with investors. In hope of aiding them in finding their financial independence.
Copyright © 2014 Tony Caldaro - All Rights Reserved Disclaimer: The above is a matter of opinion provided for general information purposes only and is not intended as investment advice. Information and analysis above are derived from sources and utilising methods believed to be reliable, but we cannot accept responsibility for any losses you may incur as a result of this analysis. Individuals should consult with their personal financial advisors.
Tony Caldaro Archive |
© 2005-2022 http://www.MarketOracle.co.uk - The Market Oracle is a FREE Daily Financial Markets Analysis & Forecasting online publication.