


U.S. Dollar Forex Trading Alert - Remains Mixed Against Major Currencies
Currencies / Forex Trading Feb 12, 2014 - 10:30 AM GMTBy: Nadia_Simmons

 The U.S. dollar remains mixed against major currencies after Federal Reserve Chair Janet Yellen signaled that recent soft economic data haven't swayed the central bank from a strategy of trimming its monthly bond purchases by $10 billion at each of its policy meetings this year. What impact did this event have on major currency pairs? If you want to know our take on this question, we invite you to read our today's Forex Trading Alert.
In our opinion the following forex trading positions are justified - summary:
- EUR/USD: none
- GBP/USD: none
- USD/JPY: none
- USD/CAD: none
- USD/CHF: none
- AUD/USD: none
EUR/USD
Quoting our last Forex Trading Alert:
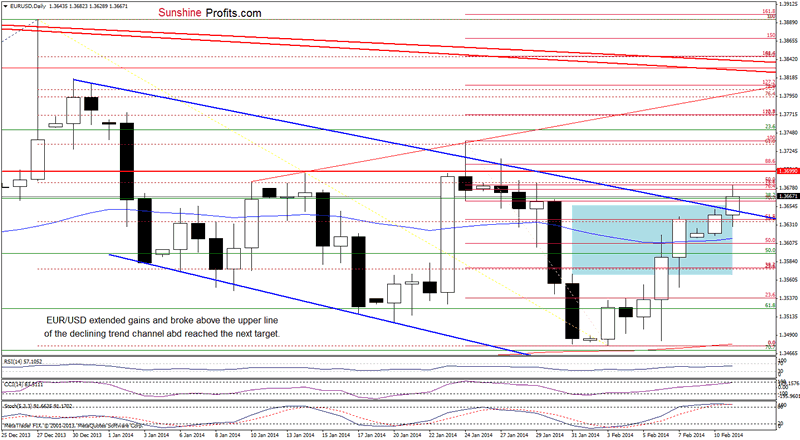
(...) the pair extended gains and almost touched the upper line of the declining trend channel (and also its upside target at 1.3660) (...) if this resistance line is broken, we may see further improvement and the initial upside target would be around 1.3676-1.3682, where the 76.4% and 78.6% Fibonacci retracement levels are.
As you see on the above chart, EUR/USD extended gains and reached its next upside target earlier today. However, a strong resistance zone created by the Jan. 28 high and the 76.4% and 78.6% Fibonacci retracement levels encourages sellers to act and we saw a pullback. With this downswing, the pair declined below the line of the declining trend channel. Despite this drop, the buyers do not give up and managed to push the exchange rate above this resistance line once again. This is a positive signal and it seems that if EUR/USD breaks above today's intraday high, we may see further improvement (to around the level of 1.3700). Nevertheless, we should keep in mind that the position of the CCI and Stochastic Oscillator suggests that we may see another attempt to move lower in the nearest future. Please note that the nearest support is still the 50-day moving average.
Before we summarize this currency pair, we would like to quote our Forex Trading Alert posted on Feb.6, 2014:
(...) EUR/USD broke above the upper border of the consolidation range (...) according to theory, the upside target for this pattern will be around 1.3660 (slightly below the upper line of the declining trend channel (...) this move seems too small for us to open a long position (however, it is something that day-traders might want to consider taking advantage of).
Taking into account the fact that the pair reached this upside target earlier today, in our opinion it is justified to close these positions and taking profits off the table - that is if you had opened them.
Very short-term outlook: bullish Short-term outlook: mixed with bullish bias MT outlook: mixed LT outlook: bearish
Trading position (short-term): In our opinion no positions are justified from the risk/reward perspective. We will keep you informed should anything change, or should we see a confirmation/invalidation of the above.
GBP/USD
Quoting our last Forex Trading Alert:
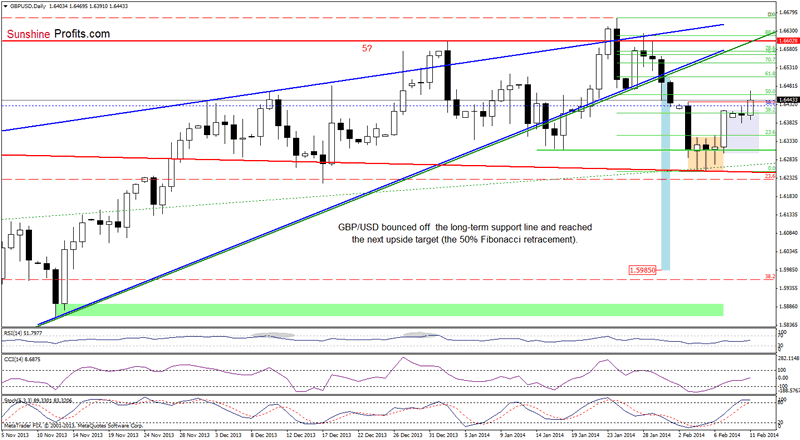
(...) GBP/USD remains around Friday's high (slightly above the 38.2% Fibonacci retracement level based on the recent decline) (...) buy signals generated by the CCI and Stochastic Oscillator remain in place and suggest that further improvement is likely to be seen. The nearest resistance level is created by Feb.3 at the moment. If it is broken, the next upside target will be the 50% Fibonacci retracement (slightly below the Jan.27 low).
Looking at the above chart, we see that the pair extended gains and reached both upside targets. Additionally, GBP/USD broke above the upper line of a consolidation range, which suggests that if the buyers do not give up, we may see an upswing to at least the 61.8% Fibonacci retracement level (the price target for this pattern is around 1.6531). Nevertheless, if the 50% Fibonacci retracement encourages sellers to act, we may see a pullback even to around 1.6347, where the previously-broken upper line of the consolidation range is.
Very short-term outlook: bullish Short-term outlook: mixed with bullish bias MT outlook: mixed LT outlook: mixed
Trading position (short-term): In our opinion no positions are justified from the risk/reward perspective. We will keep you informed should anything change, or should we see a confirmation/invalidation of the above.
USD/JPY
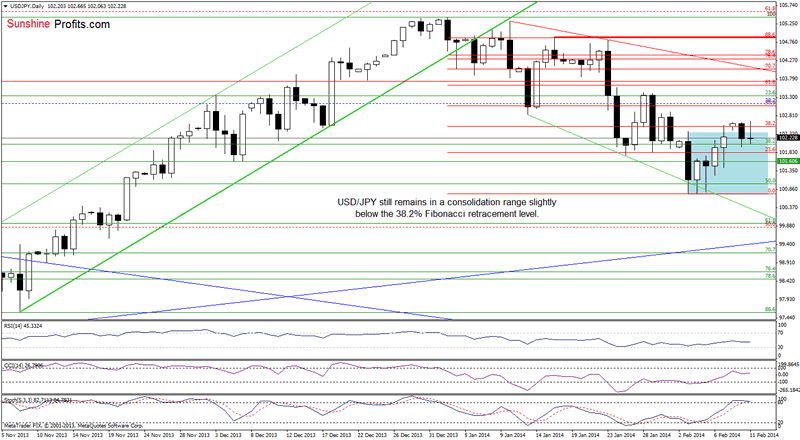
On the above chart, we see that the situation hasn't changed much. Although USD/JPY moved higher and hit a fresh one-week high, the pair quickly reversed and came back to the consolidation range. This is not a positive signal - especially when we factor in a resistance level (created by the 38.2% Fibonacci retracement level based on the recent decline) and the current position of the Stochastic Oscillator (which is close to generating a sell signal). If these circumstances encourage the sellers to act, we may see another attempt to move lower. If this is the case, the first downside target will be around 101.43 where Friday low is. On the other hand, if the buyers do not give up and push the exchange rate higher, we may see an upswing to the next Fibonacci retracement level (around 103.08).
Very short-term outlook: mixed Short-term outlook: mixed with bearish bias MT outlook: bullish LT outlook: bearish
Trading position (short-term): In our opinion no positions are justified from the risk/reward perspective. We will keep you informed should anything change, or should we see a confirmation/invalidation of the above.
USD/CAD
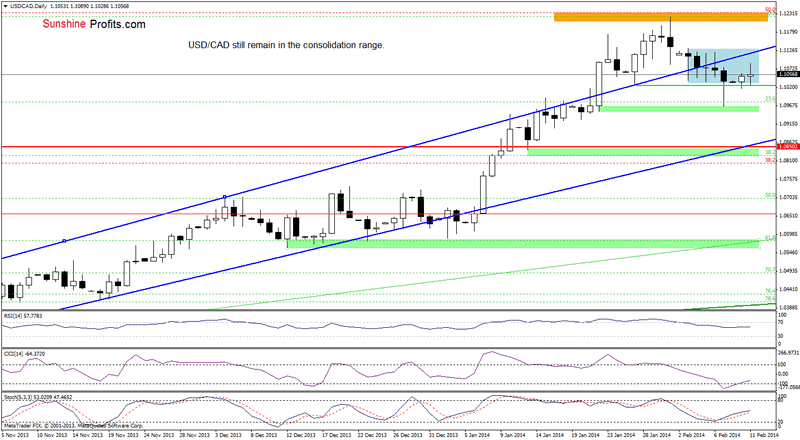
Looking at the above chart, we see that the situation hasn't changed much as USD/CAD still remains in the consolidation range. Therefore, what we wrote in our previous Forex Trading Alert remains up-to-date.
(...) If the buyers do not give up, we may see further improvement - especially when we take into account buy signals generated by the CCI and Stochastic Oscillator. If this is the case, the first upside target will be the previously-broken upper line of the rising trend channel. Nevertheless, if they fail (and the pair doesn't come back above this resistance line), we may see another attempt to move lower. Please note that if the exchange rate drops below the Jan.22 low, it will likely trigger a decline to 1.0904 (the Jan. 16 low) or even to a strong support zone created by the 38.2% Fibonacci retracement level (based on the entire Sept.-Jan. rally), the lower border of the trend channel, the Jan. 13 low and the 2010 high.
Very short-term outlook: mixed Short-term outlook: mixed MT outlook: bullish LT outlook: bearish
Trading position (short-term): In our opinion no positions are justified from the risk/reward perspective. We will keep you informed should anything change, or should we see a confirmation/invalidation of the above.
USD/CHF
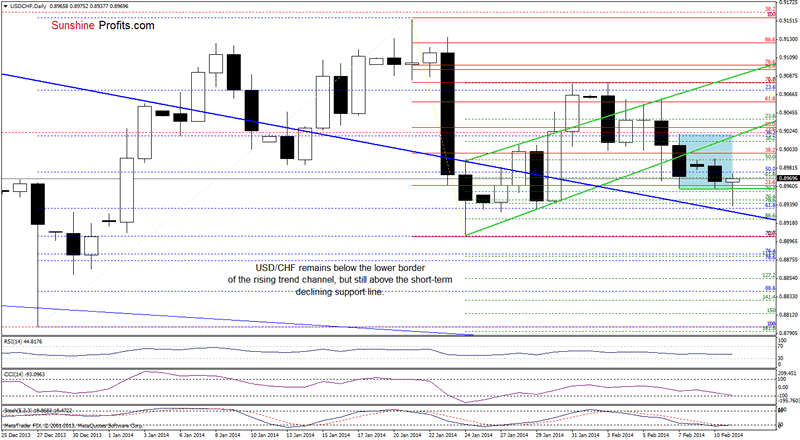
Quoting our last Forex Trading Alert:
(...) the pair declined once again and reached Friday's low. If the buyers manage to hold this support level and the exchange rate climbs above today's intraday high, we may see a post double bottom rally (...) if USD/CHF declines below Friday's low, we will likely see further deterioration and the downside target will be the short-term declining support line (marked with blue).
As you see on the above chart, we noticed such price action earlier today. The exchange rate broke below a support level created by Friday's low and almost touched the short-term declining support line (marked with blue). On the above chart, we see that the proximity to this strong support encouraged buyers to act and resulted in an upswing that took the pair to a consolidation range (marked with blue). This is a positive signal - especially when we factor in the position of the CCI and Stochastic Oscillator. Please note that both indicators are oversold, which suggests that a pause or corrective upswing is just around the corner.
Very short-term outlook: mixed with bearish bias Short-term outlook: mixed MT outlook: bearish LT outlook: bearish
Trading position (short-term): In our opinion no positions are justified from the risk/reward perspective. We will keep you informed should anything change, or should we see a confirmation/invalidation of the above
AUD/USD
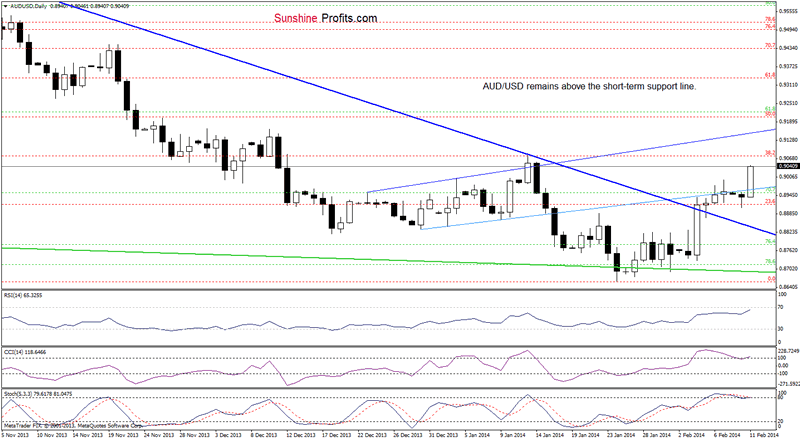
Looking at the above chart, we see that AUD/USD extended gains, broke above Friday's high and climbed to 0.9046. With this upswing, the pair also approached its upside target around 0.9069. When we take a closer look, we see that there are negative divergences between the CCI, Stochastic Oscillator and the exchange rate, which is a bearish signal. Additionally, they both are overbought (on top of that, the latter generated a sell signal), which suggests that a pullback is just around the corner.
Nevertheless, as long as the exchange rate remains above the short-term blue rising line, the space for declines seems limited.
Very short-term outlook: bullish Short-term outlook: mixed with bullish bias MT outlook: bearish LT outlook: bearish
Trading position (short-term): taking into account negative divergences between the indicators and the exchange rate (and also the fact that they are overbought), we might see a pullback in the near future. Therefore, in our opinion, it is justified to close long positions and to take profits off the table (we wrote that it was a good idea to open long positions in AUD/USD in the Feb 5, Forex Trading Alert).
Thank you.
Nadia Simmons
Sunshine Profits‘ Contributing Author
Oil Investment Updates
Oil Trading Alerts
* * * * *
Disclaimer
All essays, research and information found above represent analyses and opinions of Nadia Simmons and Sunshine Profits' associates only. As such, it may prove wrong and be a subject to change without notice. Opinions and analyses were based on data available to authors of respective essays at the time of writing. Although the information provided above is based on careful research and sources that are believed to be accurate, Nadia Simmons and his associates do not guarantee the accuracy or thoroughness of the data or information reported. The opinions published above are neither an offer nor a recommendation to purchase or sell any securities. Nadia Simmons is not a Registered Securities Advisor. By reading Nadia Simmons’ reports you fully agree that he will not be held responsible or liable for any decisions you make regarding any information provided in these reports. Investing, trading and speculation in any financial markets may involve high risk of loss. Nadia Simmons, Sunshine Profits' employees and affiliates as well as members of their families may have a short or long position in any securities, including those mentioned in any of the reports or essays, and may make additional purchases and/or sales of those securities without notice.
© 2005-2022 http://www.MarketOracle.co.uk - The Market Oracle is a FREE Daily Financial Markets Analysis & Forecasting online publication.