


Silver Prices Rise Dramatically At The End - Are We Close To The End?
Commodities / Gold and Silver 2014 Feb 17, 2014 - 02:19 PM GMTBy: Hubert_Moolman

 Silver or the silver price is generally much more difficult to analyze than gold. Part of the reason is that so much less is known about the specifics of the silver market. Silver analysis is often done "through" the analysis of gold. This is not completely wrong, since silver and gold mostly moves in a similar manner - they have the same monetary properties after all.
However, it must be understood that despite their similar properties, they have different monetary histories (the last 400 years at least). These different histories have had the effect of causing silver to be scarce in a monetary form (silver suitable for pure investment demand like bullion), for example. The fact that few central banks hold silver, compared to gold, is another example of an effect that the different monetary histories had on these markets.
These and other differences affect relative price movements of gold and silver (especially with regard to timing and extent of price movement), and can often be seen on the charts. One example of such a difference that can be seen on the charts, are the fact that gold often bottoms before silver does. The current bull market started after gold bottomed in 1999, whereas silver only bottomed in 2001, for example.
These differences (divergence) can often be seen in all time frames (short-term to very long-term). However, the tendency for most people is to be aware of the short-term and maybe the medium term, but completely be ignorant of the long-term.
This kind of divergence, as you will see (later), is the reason why many look at silver and gold's relative performance, and then make the conclusion that silver is not money, when the fact is that due to the significant distinct long-term timing; silver is at a different place than gold, on its way to be valued fairly.
I would like to illustrate that this divergence highlights why silver is such incredibly good value at the moment, and why the coming silver price rally will likely dwarf everything else. This is an aspect I have written about already.
Below, are very long-term charts of silver (top) and gold (bottom):
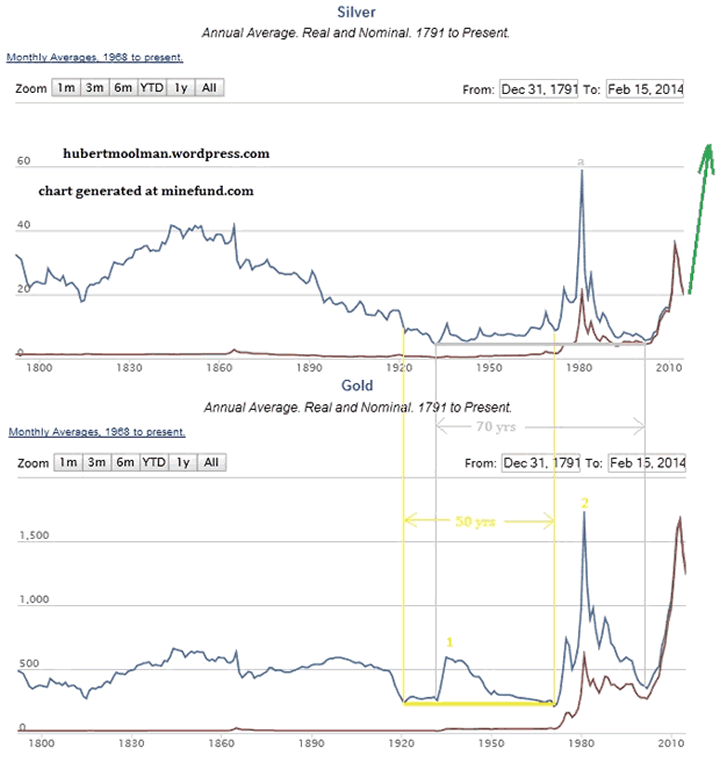
The blue is the real price, and the red is the nominal price of silver and gold. For this analysis, we will focus on the real price. On the gold chart, the real price of gold bottomed in 1920 and in 1970, which could be described as a 50-year double-bottom. In 1935 (point 1), for the first time since the first bottom, did gold make an attempt to test the previous highs in place during the majority of the 1800s.
On the silver chart, the real price of silver bottomed in 1931 and again in 2001, which could be described as a 70-year double- bottom. That is 20 years longer than gold's bottom, quite a massive divergence. In 1980 (point a), for the first time since the first bottom, did silver make an attempt to test the previous highs in place since the 1800s, and actually exceeded it for a while, which is typical of how silver can spike. So, silver actually technically did what gold did at least 40 years earlier - again, a massive divergence.
After the second bottom of gold in 1970, gold started a rally that ended much higher (at point 2 in 1980) than the previous highs of the 1800s. That is what rallies after valid double-bottoms normally do. Now, as I have said above, silver made the second bottom of its double bottom in 2001, and has started a rally since then. If it continues to follow what gold did, as well as what normally happens after a valid double bottom, then this rally will end much higher than the real highs of the 1800s.
Given the fact that silver has a tendency to spike much more than gold does, and what I call: "silver's short body long tail effect"; then we should expect massively high silver prices during this coming rally. When you compare the silver chart to the gold chart, you will see how silver often rises slowly for the majority of a significant rally (short body) but will rise significantly fast at the very tail-end of the rally (long tail).
So, this is telling me that silver is actually technically where gold was in the 80s. Furthermore, the fact that silver only bottomed in 2001, whereas gold bottomed in 1970 (30 years earlier), would in some way explain why silver's behaviour would mostly cause people to believe that it is not money - at least not like how they consider gold to be money.
For more silver and gold analysis and guidance, see my Long-term Silver Fractal Report or subscribe to my Premium Service.
Warm regards and God bless,
Hubert
http://hubertmoolman.wordpress.com/
You can email any comments to hubert@hgmandassociates.co.za
© 2014 Copyright Hubert Moolman - All Rights Reserved
Disclaimer: The above is a matter of opinion provided for general information purposes only and is not intended as investment advice. Information and analysis above are derived from sources and utilising methods believed to be reliable, but we cannot accept responsibility for any losses you may incur as a result of this analysis. Individuals should consult with their personal financial advisors.
© 2005-2022 http://www.MarketOracle.co.uk - The Market Oracle is a FREE Daily Financial Markets Analysis & Forecasting online publication.