


Crude Oil Price Breakdown or Trap?
Commodities / Crude Oil Jun 19, 2014 - 09:18 AM GMTBy: Nadia_Simmons

 On Tuesday, the price of crude oil wobbled between gains and losses throughout the session as mixed data and profit taking weighed on investors' sentiment. As a result, light crude reversed after an increase to the resistance zone and declined below an important medium-term support line. Will this event be strong enough to trigger a sizable correction?
As you know from our previous Oil Trading Alerts, the major factor that has driven crude oil higher in recent days was the deteriorating situation in Iraq - the seventh-largest oil producer in the world last year and OPEC's second-most-important producer country. Thanks to the Iraqi crisis, light crude increased to a nine-month high, but it seems that the impact of the Iraq violence on the price could be short-lived as investors figured out that active oilfields remain far south from the insurgency and disruption fears are overdone - especially when we take into account the fact that U.S. oil production is booming and most of that oil cannot be exported under current law.
Additionally, mixed data encouraged oil investors to jump to the sidelines. Yesterday, the Commerce Department reported that housing starts dropped by 6.5% in May, while the number of building permits issued fell by 6.4% in the previous month. Although these numbers disappointed, upbeat inflation data supported crude oil. Please note that the Labor Department reported that the U.S. CPI rose 2.1% on year in May and 0.4% from April.
How did these circumstances influence the technical picture? Let's check (charts courtesy of http://stockcharts.com).
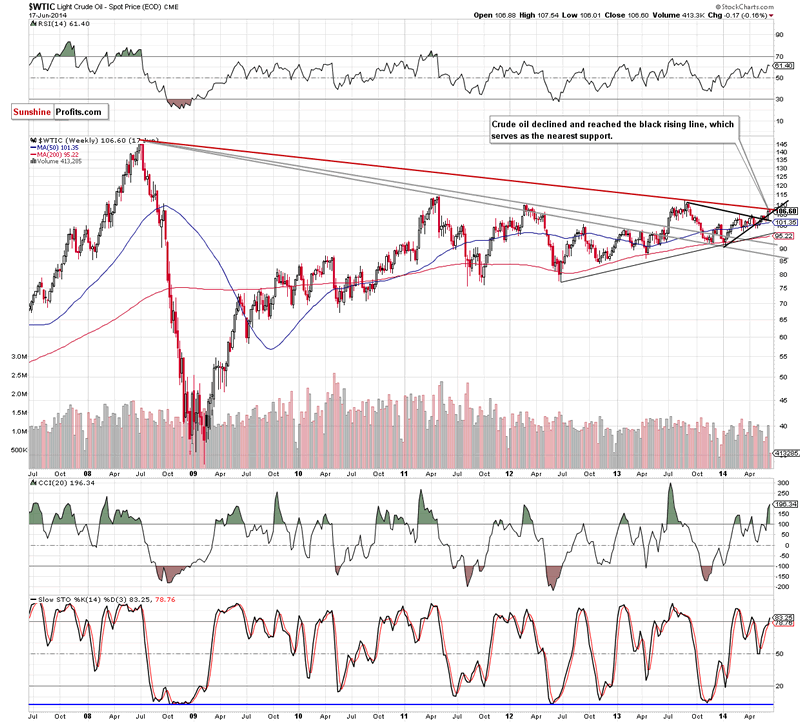
Looking at the weekly chart, we see that the situation has deteriorated slightly as crude oil moved lower and reached the rising black support line. If it holds, we will likely see another attempt to break above the long-term declining line, which triggered a pullback earlier this week. However, taking into account the position of the indicators (the CCI and Stochastic Oscillator are overbought), it seems to us that further deterioration is just around the corner - especially if crude oil breaks below its major medium-term support line (marked with black).
Will we see such price action in the coming days? Let's take a closer look at the daily chart.
In our last Oil Trading Alert, we wrote the following:
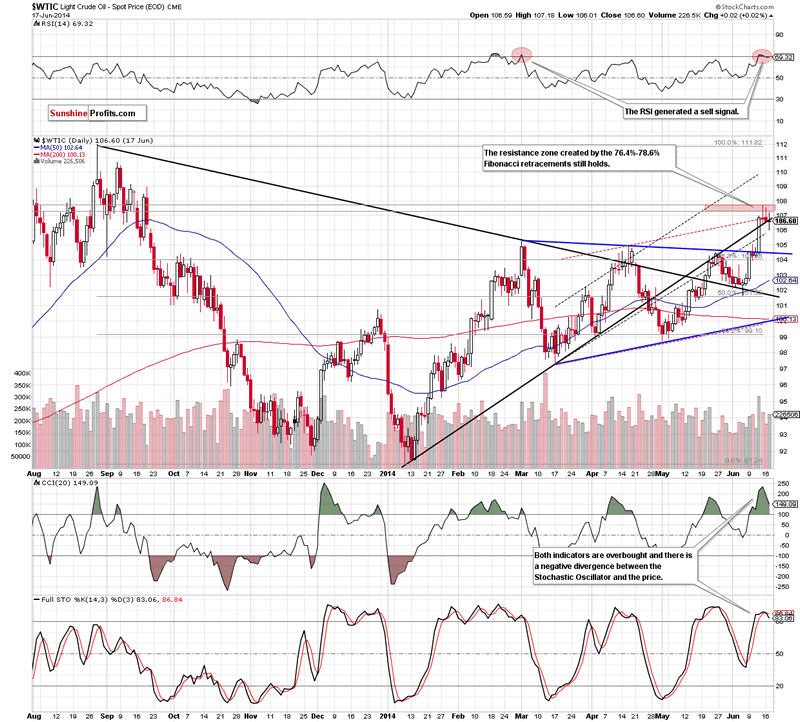
(...) the initial downside target for oil bears will be the previously-broken medium-term black rising line (currently around $106.60), which stopped further deterioration on Friday. (...) if this line holds, we may see another attempt to break above the resistance zone. However, if it is broken, the current correction will accelerate and the commodity will find support around $104.55, where the upper line of the medium-term triangle (marked with blue) is.
From this perspective, we see that although oil bulls tried to realized the above-mentioned scenario, they failed and the commodity declined under the medium-term black rising line, closing the day slightly below it. In our opinion, this is a bearish signal, which suggests further deterioration. We are convinced that the current correction will accelerate, if light crude drops under the black dashed support line (currently around $105.95) and the CCI and Stochastic Oscillator generate sell signals. In this case, the above-mentioned downside target around $104.55 will be in play. Meanwhile, as long as crude oil remains around its black support line, another try to climb above the resistance zone can't be ruled out.
Summing up, although crude oil moved higher, the strong resistance zone created by the long-term declining line and two important Fibonacci retracement levels triggered a pullback, which took the commodity below the medium-term black rising line. Taking this fact into account, we remain bearish and think that if light crude declines from here, we'll see a drop to at least the medium-term blue support line (around $104.55).
Very short-term outlook: bearish
Short-term outlook: mixed with bearish bias
MT outlook: mixed
LT outlook: mixed
Trading position (short-term; our opinion): Short. Stop-loss order at $109.20.
Thank you.
Nadia Simmons
Sunshine Profits‘ Contributing Author
Oil Investment Updates
Oil Trading Alerts
* * * * *
Disclaimer
All essays, research and information found above represent analyses and opinions of Nadia Simmons and Sunshine Profits' associates only. As such, it may prove wrong and be a subject to change without notice. Opinions and analyses were based on data available to authors of respective essays at the time of writing. Although the information provided above is based on careful research and sources that are believed to be accurate, Nadia Simmons and his associates do not guarantee the accuracy or thoroughness of the data or information reported. The opinions published above are neither an offer nor a recommendation to purchase or sell any securities. Nadia Simmons is not a Registered Securities Advisor. By reading Nadia Simmons’ reports you fully agree that he will not be held responsible or liable for any decisions you make regarding any information provided in these reports. Investing, trading and speculation in any financial markets may involve high risk of loss. Nadia Simmons, Sunshine Profits' employees and affiliates as well as members of their families may have a short or long position in any securities, including those mentioned
© 2005-2022 http://www.MarketOracle.co.uk - The Market Oracle is a FREE Daily Financial Markets Analysis & Forecasting online publication.