


Stock Market Rising
Stock-Markets / Stock Markets 2014 Jul 09, 2014 - 04:48 PM GMT

 Good Morning!
Considering that the FOMC minutes are being released at 2:00 pm today, it would normally follow that equities may stay elevated until then.
There are three waves in the decline so far. If the SPX has a limited bounce and declines at least to mid-Cycle support at 1955.96, then SPX would have a clean 5 waves. A 50% retracement may limit the bounce this morning to 1972.52 which would still allow a fifth wave.
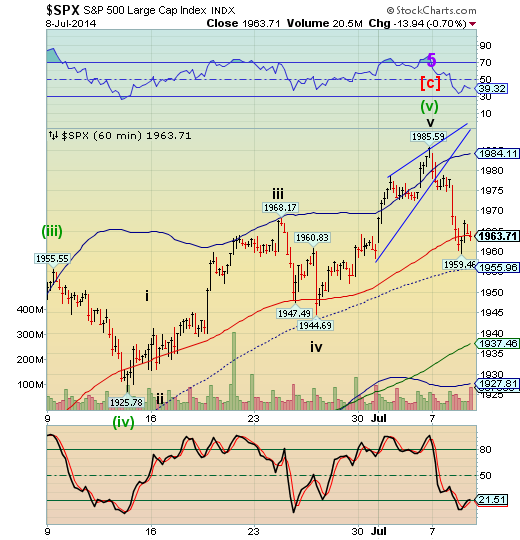
Otherwise if SPX rallies to 1975 or higher the formation is an a-b-c. That would still work in an Ending Diagonal Super Cycle Wave (c) , but becomes more difficult to track.
Let’s hope for the first scenario, since it will make our lives much easier.
ZeroHedge reports, “(Chinese) Producer Prices had another negative print, the 28th in a row, and have remained negative since 2012. This led to the Hang Seng Index falling at the fastest rate since late June to erase all YTD gains. However, as has now become the norm, macro news hardly impacted US equity futures, which are driven exclusively by the Yen carry trade, which unlike yesterday's pounding, has traded range bound between 101.6-101.7 keeping US equity futures just barely in the green. We expect the momentum ignition algo to kick in at some point, for absolute no fundamental reason beside the NY Fed trading desk issuing a green light, sending the USDJPY surging, taking the Spoos with them, and helping stocks forget all about the weak Asian session.”
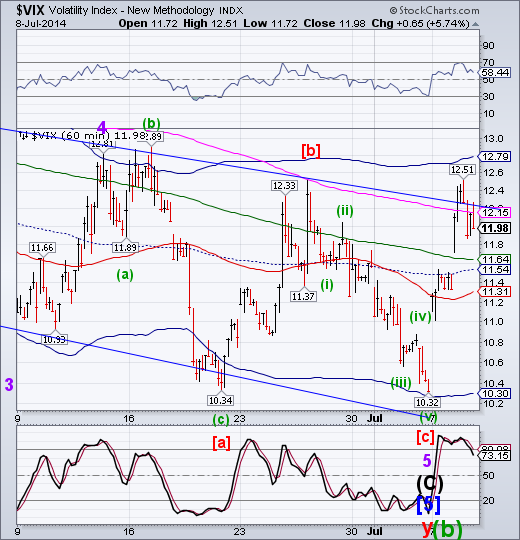
VIX also has three waves from its July 3 low. It has exactly matched its Minute Wave [b] high of 12.51, so there is no breakout above prior highs, but “challenge” of the trading channel trendline. A decline to Intermediate-term support at 11.64 or possible mid-Cycle support at 11.54 would allow VIX to complete a five wave impulse or possibly even a more complex, extended one. If that is the case, then VIX may break above its Cycle Top resistance at 12.79 ant its Wave 4 (b) high of 12.89. This would set a much clearer tone for the decline in SPX.
From ZeroHedge, “Feeling stressed? Worried about the financial markets? Don't be - the Fed has an index for that. The St. Louis Fed 'financial stress index', constructed from 18 weekly data series (6 interest rates, 6 yield spreads, and 5 others) fell to a record low for the 3rd week in a row signaling all-clear... right? Just one thing, in a world entirely disintermediated by central banking largesse, just how relevant are these 'market' indications of financial stress? As Bloomberg warns, the financial stress index has now been below zero for 130 consecutive weeks, the longest period since 2008.”
There is a blog suggesting the Fed may allow a “controlled decline” to happen. I disagree. First, I believe that the Fed is clueless about bubbles (see above). Second, Any talk about bubbles or preventing them may just be just “whistling past the graveyard.”
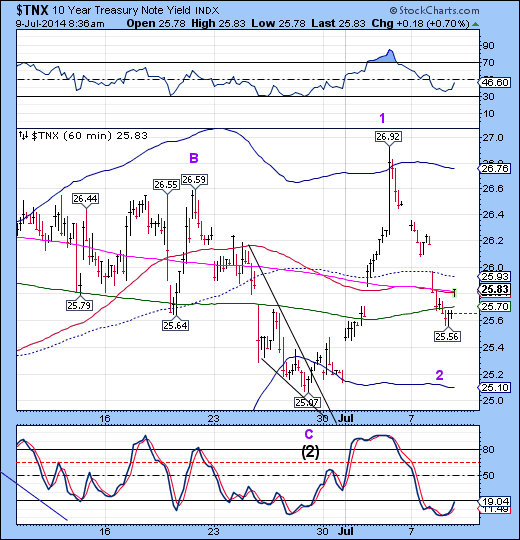
TNX has completed its retracement and appears to be in a hurry to go much higher. This would be typical of a Minor Wave 3. The Cycles Model suggests rising rates through the end of July. A breakout above its daily Cycle top at 29.61 or possibly its prior high at 30.36 is possible.
Regards,
Tony
Our Investment Advisor Registration is on the Web
We are in the process of updating our website at www.thepracticalinvestor.com to have more information on our services. Log on and click on Advisor Registration to get more details.
If you are a client or wish to become one, please make an appointment to discuss our investment strategies by calling Connie or Tony at (517) 699-1554, ext 10 or 11. Or e-mail us at tpi@thepracticalinvestor.com .
Anthony M. Cherniawski, President and CIO http://www.thepracticalinvestor.com
As a State Registered Investment Advisor, The Practical Investor (TPI) manages private client investment portfolios using a proprietary investment strategy created by Chief Investment Officer Tony Cherniawski. Throughout 2000-01, when many investors felt the pain of double digit market losses, TPI successfully navigated the choppy investment waters, creating a profit for our private investment clients. With a focus on preserving assets and capitalizing on opportunities, TPI clients benefited greatly from the TPI strategies, allowing them to stay on track with their life goals
Disclaimer: The content in this article is written for educational and informational purposes only. There is no offer or recommendation to buy or sell any security and no information contained here should be interpreted or construed as investment advice. Do you own due diligence as the information in this article is the opinion of Anthony M. Cherniawski and subject to change without notice.
Anthony M. Cherniawski Archive |
© 2005-2022 http://www.MarketOracle.co.uk - The Market Oracle is a FREE Daily Financial Markets Analysis & Forecasting online publication.