


European Stock Markets Leading Again?
Stock-Markets / Stock Markets 2014 Jul 13, 2014 - 04:34 PM GMTBy: Tony_Caldaro

 The market opened the week on a gap down, one of several, as it started to correct from last week’s SPX 1986 all time high. After hitting SPX 1953 on Thursday the market tried to rebound into Friday’s close. For the week the SPX/DOW were -0.80%, the NDX/NAZ were -1.05%, and the DJ World index was down 1.55%. Economic reports were sparse on this first full trading week of the quarter. On the uptick: consumer credit, wholesale inventories, the WLEI, a Treasury surplus, and weekly jobless claims improved. On the downtick: the monetary base. Next week we have the FED’s beige book, Industrial production and reports on Housing, to name a few, within a busy week.
LONG TERM: bull market
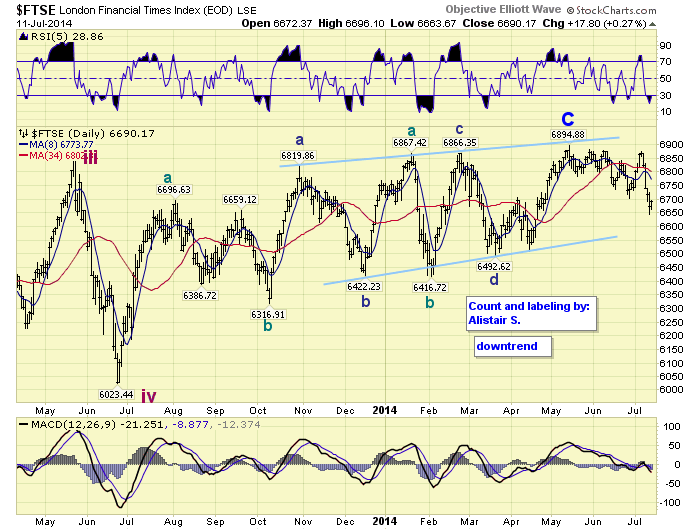
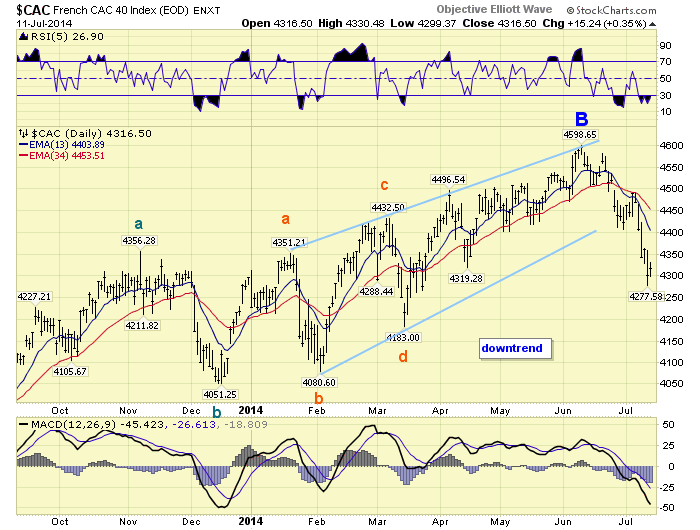
The bull market went on pause this week as Portugal’s largest bank ran into problems, and fears of another European banking crisis arose. If you recall, the steep corrections of 2010 (17%) and 2011 (22%) were both European related. For the past three years Europe’s markets have been rising while their various problems have appeared under control. The charts, however, are suggesting this is just the beginning of a new set of problems as noted in this recent report: https://caldaro.wordpress.com/2014/06/16/europe-potential-market-turbulance-ahead-by-mid-late-2014/. In fact, England and France have already given back nearly all of their gains for 2014. Plus, all eight European indices we track are in downtrends.
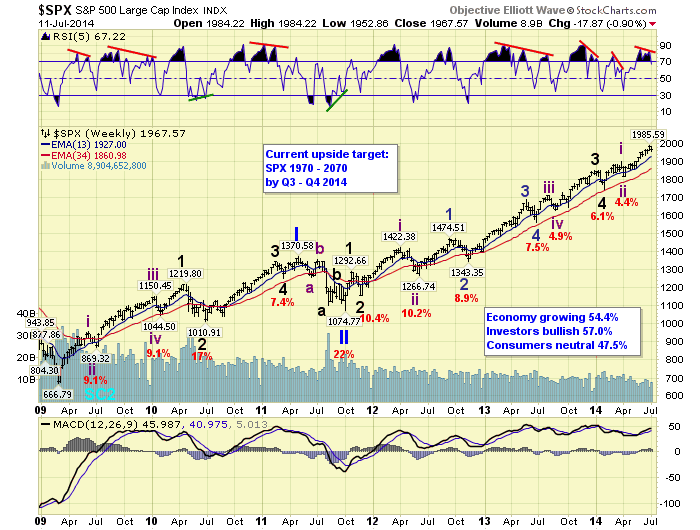
The US market, however, has not yet reached its somewhat treacherous threshold. Primary wave III, of this five Primary wave bull market, continues to unfold generally as expected. Yet, as noted by the weekly chart below, Primary wave III appears to be nearing an end. It is just a downtrend and uptrend away from its conclusion. A Primary IV correction, similar to Primary II’s correction, could unfold with the catalyst again centered in Europe. For now, the SPX still needs to confirm an Intermediate wave iv downtrend, then an uptrend to new highs to complete Intermediate v, Major 5 and Primary III.
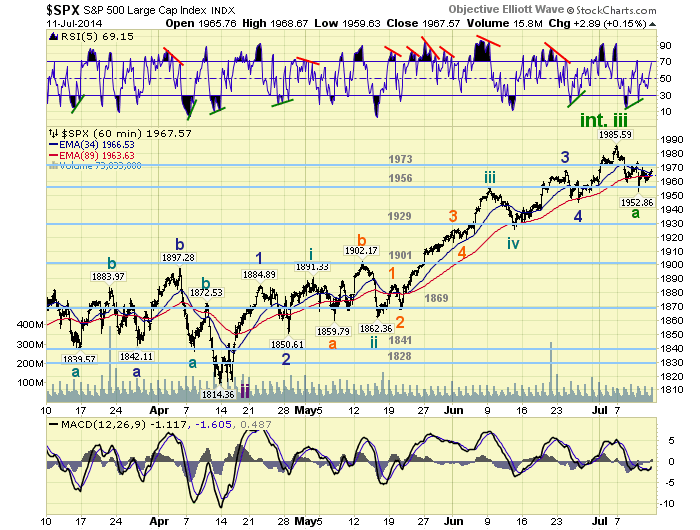
MEDIUM TERM: uptrend probably topped
The mid-April Intermediate wave iii uptrend from SPX 1814 probably topped recently at 1986. The uptrend appears to have completed five Minor waves, with the fifth wave nearly a perfect 0.618 relationship to the first. Adding to this probability is the fact that all eight of Europe’s indices are in confirmed downtrends, and there are negative divergences, in the US, on the daily and weekly RSI/MACD.
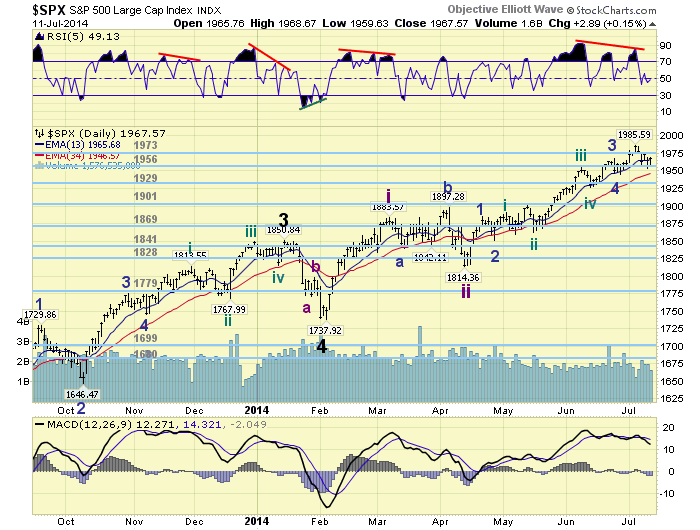
With a weak Minor wave 5 downtrend support is unlikely to be found at Minor 4 (1945), or even Minute iv of Minor 3 (1926). Fibonacci relationships suggests two potential levels: 1920 (38.2%) and 1900 (50.0%). Since 1920 is outside of the 1929 pivot range, but 1900 is within the 1901 pivot range, we will carry all three as support. We are not expecting a long drawn out correction, and are looking for a low this month. Thus far, the market is acting somewhat like the Major wave 4 correction in January: remaining relatively close to the highs during the first week of the correction. Oddly enough, that was the last time all European indices were in confirmed downtrends too. Medium term support remains at the 1956 and 1929 pivots, with resistance at the 1973 and 2019 pivots.
SHORT TERM
Short term support is at the 1956 and 1929 pivots, with resistance at the 1973 pivot and SPX 1986. Short term momentum ended the week overbought. The short term OEW charts flip-flopped all week, which is generally a sign of a correction, and ended with the reversal level at SPX 1965.
Thus far we are counting this potential downtrend with three Minor waves. Minor wave A appears to have completed with an a-b-c down (1959-1974-1953). Minor wave B looks to be doing an a-b-c up (1970-1960-1969 so far). Resistance should remain at the 1973 pivot range, and support at the 1956 pivot range until it breaks. Best to your trading!
FOREIGN MARKETS
The Asian markets were mostly lower for a net loss of 0.5%.
The European markets were all lower for a net loss of 3.9%.
The Commodity equity group were mixed for net gain of 0.1%.
The DJ World index lost 1.5% on the week.
COMMODITIES
Bond yields are very close to confirming a downtrend, Bonds gained 0.9% on the week.
Crude is in a downtrend and lost 3.1% on the week.
Gold continues to uptrend gaining 1.3% on the week.
The USD is still barely in an uptrend but lost 0.1% on the week.
NEXT WEEK
Tuesday: Retail sales, the NY FED, Export/Import prices and Business inventories. Wednesday: the PPI, Industrial production, NAHB housing and the FED’s beige book. Thursday: weekly Jobless claims, Housing starts, Building permits, and the Philly FED. Friday: Consumer sentiment, Leading indicators and Options expiration. FED chair Yellen gives her semi-annual report to the Senate on Tuesday, and House on Wednesday. Also on Tuesday FED general counsel Alvarez testifies in Congress. It looks to be quite an interesting week. Best to your weekend and week!
CHARTS: http://stockcharts.com/public/1269446/tenpp
http://caldaroew.spaces.live.com
After about 40 years of investing in the markets one learns that the markets are constantly changing, not only in price, but in what drives the markets. In the 1960s, the Nifty Fifty were the leaders of the stock market. In the 1970s, stock selection using Technical Analysis was important, as the market stayed with a trading range for the entire decade. In the 1980s, the market finally broke out of it doldrums, as the DOW broke through 1100 in 1982, and launched the greatest bull market on record.
Sharing is an important aspect of a life. Over 100 people have joined our group, from all walks of life, covering twenty three countries across the globe. It's been the most fun I have ever had in the market. Sharing uncommon knowledge, with investors. In hope of aiding them in finding their financial independence.
Copyright © 2014 Tony Caldaro - All Rights Reserved Disclaimer: The above is a matter of opinion provided for general information purposes only and is not intended as investment advice. Information and analysis above are derived from sources and utilising methods believed to be reliable, but we cannot accept responsibility for any losses you may incur as a result of this analysis. Individuals should consult with their personal financial advisors.
Tony Caldaro Archive |
© 2005-2022 http://www.MarketOracle.co.uk - The Market Oracle is a FREE Daily Financial Markets Analysis & Forecasting online publication.