


Elliott Wave Gold Price Projection Since 1970
Commodities / Gold and Silver 2014 Jul 28, 2014 - 02:23 PM GMTBy: Trader_MC

 The market movement unfolds in waves which reflects human nature that does not change. The Elliott Wave Principle is made of motive and corrective waves. Waves 1, 3 and 5 are impulse waves as they move with the trend, Waves 2 and 4 are corrective waves as they partially retrace the previous impulse move. A complete sequence is made of 8 waves: a 5-wave motive phase (1, 2, 3, 4, 5) and a basic 3-wave corrective phase (A, B, C).
From January 1970 until now we can see that Gold had 3 impulsive waves which were separated by 2 distinct countertrend corrective waves. On high scale degrees I prefer to use percentage scales.
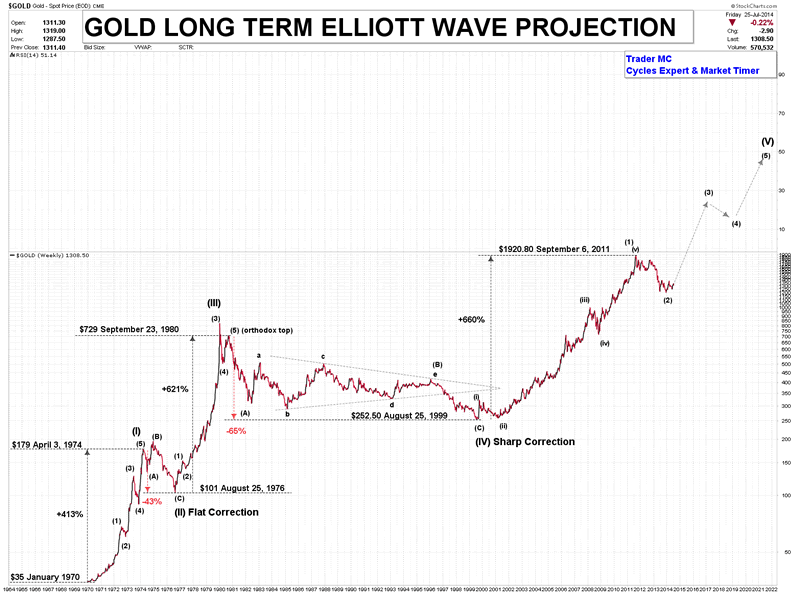
Wave (I): $35 (January 1970) to $179.50 (April 3rd, 1974) >>> +413%
Wave (II): $179.50 (April 3rd, 1974) to $101 (August 25, 1976) >>> -43%
Wave (III): $101 (August 25, 1976) to $729 (September 23,1980) >>> +621%
Wave (IV): $729 (September 23, 1980) to $252.50 (August 25 1999) >>> -65%
Wave (V): $252.50 (August 25, 1999) to … ?
You can see that that the basic rules of Elliott Waves are respected. Wave (III) (+621%) is not the shortest wave, Wave (IV) did not overlap Wave (I) and Wave (II) flat correction (-43%) alternates with Wave (IV) sharp correction (-65%).
Wave (1) of (V) from $252.50 (August 25, 1999) to $1920.80 (September 6, 2011) is already up 660% which is slightly above Wave 3 performance (+621%). That lets me think that the current Wave (V) could be extended (the extended wave is often the same number as the parent wave). I think that Gold ended a Wave (1) of (V) on September 6, 2011 at $1920.80, Wave (2) ended on June 28, 2014 at $1179.40 and Gold is currently forming a Wave (3) of (V).
There are three main reasons why I think that Wave (V) could be an extended wave:
Firstly, the extended wave is often the fifth wave in the Commodity bull market.
Secondly, a non extended Wave (V) has usually gains in Fibonacci proportion to Wave (I) from 0.618 to 1. In that case Wave (V) performance should be between 255% (0.618 x 413%) and 413% but it is already up 660% which corresponds to Wave (I) multiplied by the Golden Number (413% X 1.618 = 660%).
Thirdly, I think that September 6, 2011 was not the top as the Gold market did not yet have a mass phenomena nor herd behavior connected to all speculative bubbles; the vast majority of people do not have an idea of the current Gold price and do not look for buying Gold Metal at the moment.
Moreover, the corrective move since September 2011 high looks rather like a well organized structure corrective move than a bubble crash. In addition to technical reasons there are also many fundamental reasons for Gold to resume the bull market that I did not mention as there are already a lot of talks on the subject (devaluation of the dollar, zero rates policy, systemic public debt above 100 percent of GDP etc.)
Wave (2) of (V) from $1920.80 to $1179.40 represents a correction of 38.6% at the moment. It is less than Wave (II) (-43%) and Wave (IV) (-65%) which are corrective waves of higher degrees. It is another clue that lets me think that Wave (V) subdivides into five smaller waves.
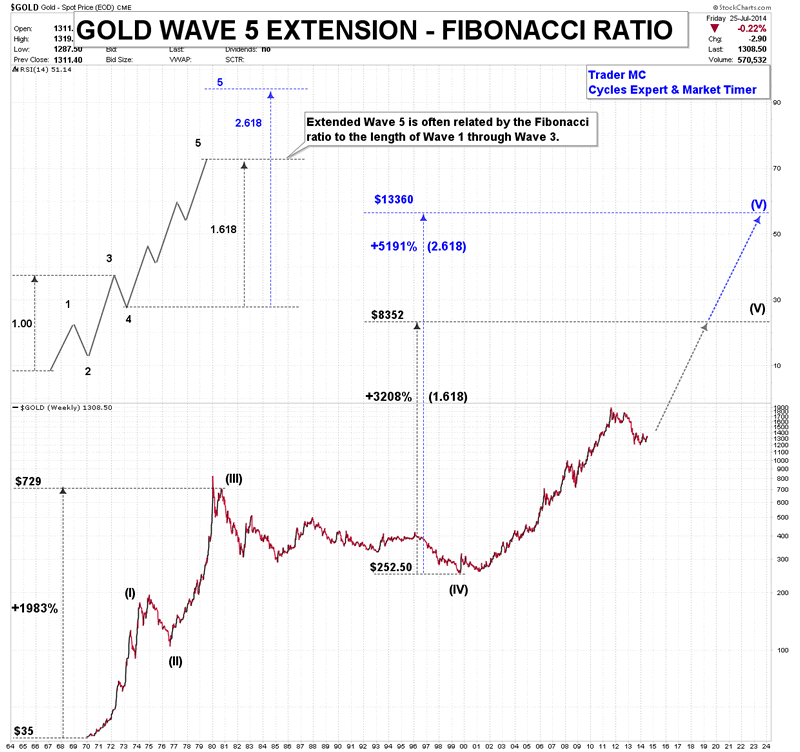
I projected the extended Wave (V) with two different methods. The first one is an extended Wave (V) related by the Fibonacci ratio to length of Wave (I) through Wave (III) (1.618 or 2.618). The performance from the bottom of Wave (I) to the top of Wave (III) was +1983%, therefore the projection with the Golden Ratio 1.618 has a target of $8352 and $13660 with 2.618.
The second method takes into account the fact that Wave (IV) usually divides an impulse wave into the Golden Section (it can be whether from the start or the end of Wave (IV)). On the following chart you can see the two possibilities, the black example (the Golden Section starts at the end of Wave (IV)) and the blue example (the Golden Section starts at the beginning of Wave (IV)).
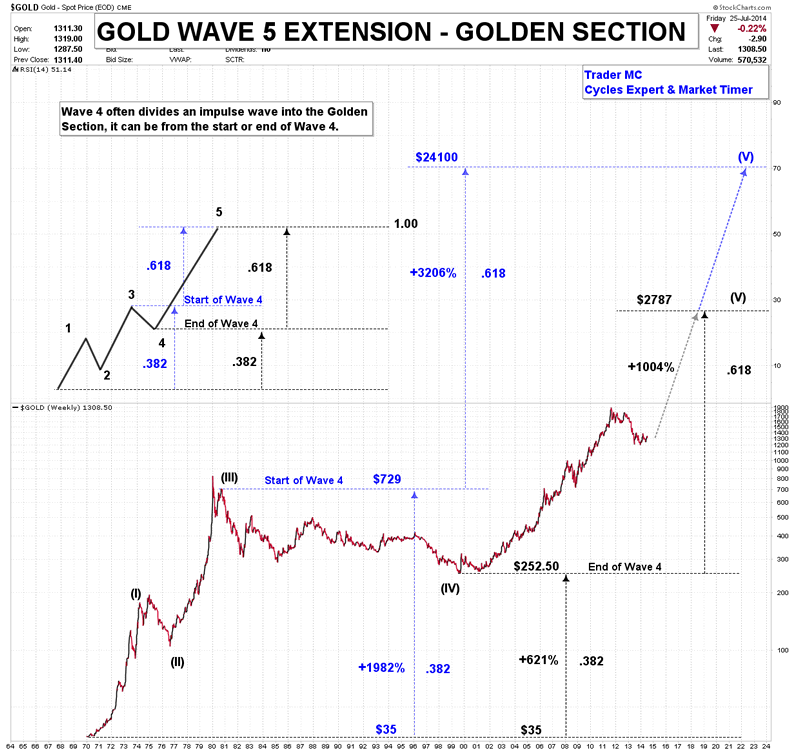
The black example shows that 0.382 begins from the bottom of Wave (I) to the end of Wave (IV) (from $35 to $252.50) which represents a performance of +621%. 0.618 begins from the end of Wave (IV) to the end of Wave (V) which represents a performance of +1004%. This projection gives a target of $2787 for Wave (V).
The blue example shows that 0.382 begins from the bottom of Wave (I) to the start of Wave (IV) (from $35 to $729) which represents a performance of +1982%. 0.618 begins from the start of Wave (IV) to the end of Wave (V) which represents a performance of +3206%. In this case the target for Wave (V) is $24100.
Whatever the case may be and according to the Elliott Wave Principle, I think that Gold is in an extended Wave (V) which has a lot of upside potential. Elliott Wave Principle helps to better understand the nature of the market movement and completed with other tools it can forecast the market progress and define important turning points with a high degree of accuracy.
Trader MC
Company: Cycle Trader MC OU
Web site: http://tradermc.com
Email: contact@tradermc.com
My analysis covers different assets – Market Indexes, such as US, Europe, Emerging Markets, China, Russia etc., Commodities, Currencies (Forex Trading), Bonds and Rates. In addition to the Markets Updates for MC Members, I also post real-time Trading Alerts for MC Leveraged Members for a more aggressive strategy in all the sectors. Besides the market analysis, this site also contains Cycles Count Updates for all Market Assets, including the Forex Market.
© 2014 Copyright Trader MC - All Rights Reserved
Disclaimer: The above is a matter of opinion provided for general information purposes only and is not intended as investment advice. Information and analysis above are derived from sources and utilising methods believed to be reliable, but we cannot accept responsibility for any losses you may incur as a result of this analysis. Individuals should consult with their personal financial advisors.
© 2005-2022 http://www.MarketOracle.co.uk - The Market Oracle is a FREE Daily Financial Markets Analysis & Forecasting online publication.