


Stocks Bear Market Formation Revealed
Stock-Markets / Stocks Bear Market Jul 30, 2014 - 10:49 AM GMTBy: EWI

 The Stock Market with Elliott Wave Labels from 1693 to Present Day Reveals a Bear Market Formation Since 2000
The following article was adapted from Robert Prechter's June 2014 issue of The Elliott Wave Theorist, one of the longest-running investment letters in the business, continuously published monthly since 1979.
Figure 1 shows the stock market's waves from 1693 to the present. The circled Roman numerals denote waves of Grand Supercycle degree, the largest complete waves for which stock market data exist.
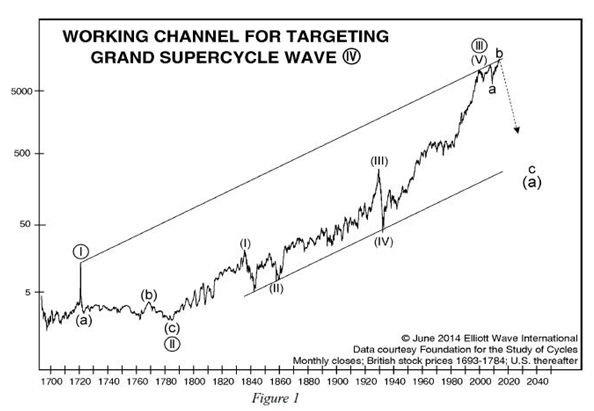
Wave I (circled) ended in 1720 at the peak of the South Sea Bubble in England. Wave II (circled) took the form of a zigzag, labeled (a)-(b)-(c); it ended in 1784. Third waves are usually extended, meaning they are longer than wave one and have clear subdivisions. This is exactly how wave III (circled) developed. It ended in 2000.
Wave III (circled) subdivides into five waves. Wave (I) ended in 1835, wave (II) in 1859, wave (III) in 1929, wave (IV) in 1932 and wave (V) in 2000.
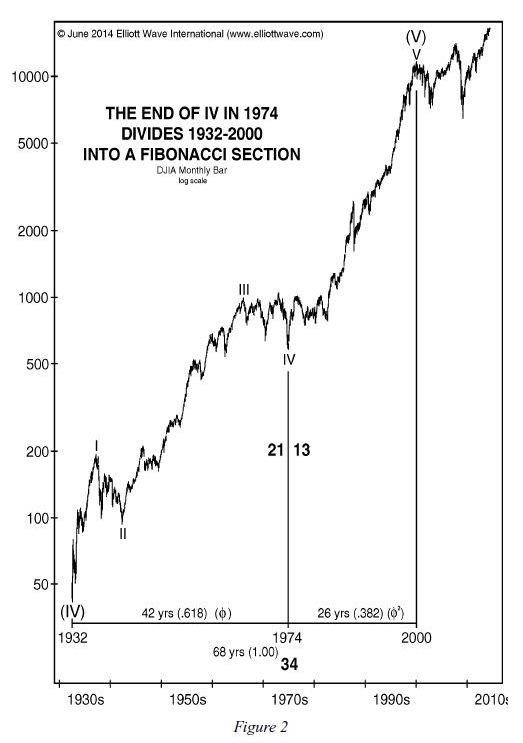
Wave (V) subdivides into five waves, as illustrated in Figure 2. Wave I ended in 1937, wave II in 1942, wave III in 1966, wave IV in 1974 or 1982, and wave V in 2000.
The guideline of alternation indicates a high probability that wave IV will be a form other than a zigzag, i.e. a flat or a triangle. Triangles are more common than flats, so our working hypothesis is that wave IV will be a triangle.
"B" waves within flats and triangles often carry beyond the end of the preceding impulse wave. For instance, the S&P Composite index made new highs in 1968 and 1973, but both of those highs occurred within the triangle of 1966-1974 (wave IV), which alternated with the zigzag of 1937-1942 (wave II).
It might seem tempting to believe that wave (V) is still in progress. But there are five reasons to mark its termination in the year 2000.
1) As established in my book Beautiful Pictures, the low of wave four often occurs at a time that subdivides the duration of an entire impulse wave into a Fibonacci section. As shown in Figure 2, waves I through IV lasted 42 years, and wave V at the peak in 2000 lasted 26 years, producing a Fibonacci time ratio of 21/13. Those two durations in turn are related to the total duration of wave (V) by the Fibonacci ratios 21/34 and 13/34.
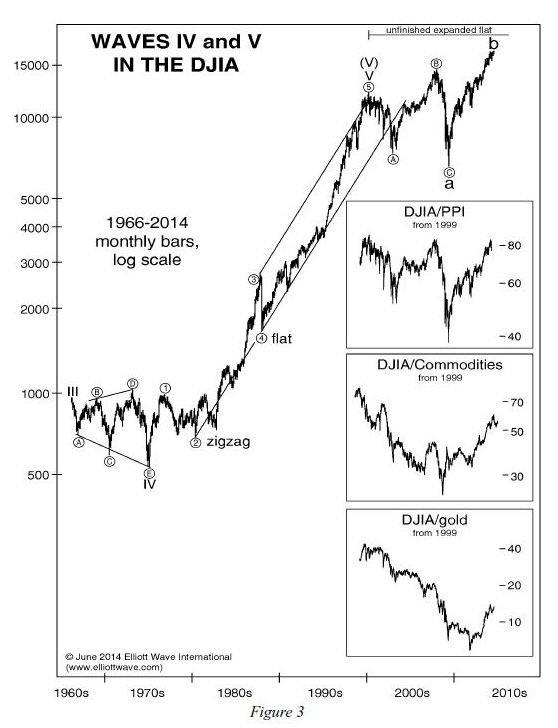
2) Wave V is best labeled as a completed five waves from 1974 to 2000, as shown in Figure 3. It adheres to a normal channel and peaks at the upper end. Labeling the high in 2000 as the "orthodox top" of wave V -- i.e. the end of the five-wave pattern regardless of ensuing higher highs -- is not just semantics. Elliott wave forms tell you which stock market advances are part of a true bull market and which are bear market rallies.
3) In the past, orthodox peaks of Elliott waves have been registered at extremes in the real value of stocks, not just their nominal value. The insets in Figure 3 show that wave b has not carried to a new high in real terms. In other words, the Dow today buys fewer producer materials, commodities and real money (gold) than it did in 2000, even though its nominal price is much higher. The Dow priced in real money -- gold -- topped in 1999 and has collapsed 84% since then, as shown in the bottom inset in Figure 3.
Had the U.S. maintained honest money, the Dow would be priced at 266 today, not 17,000. Much of the nominal Dow's progress after 1966 -- and all of its net progress since 2000 -- is due not to an increase in corporate values but to a decrease in value for the Federal Reserve's accounting unit (the "dollar"), both by deliberate central-bank policy and by the pyramiding of credit throughout the financial system, much of which has been made possible by the use of force, aka government policy.
4) The year 2000 was the end of the one-way good times. That is when the all-time high was recorded in the major averages' valuation as measured by annual dividend yield, price to book value, and the corporate bond/stock yield spread. Indicators such as Gallup's poll of Economic Confidence peaked then, too, by a wide margin. That year, economists were proclaiming a "New Economy" that would never falter. All of these events support the case that wave V, and therefore wave (V), and therefore wave III, ended in 2000.
5) Finally, even the market top of 2007 was more important than what's happening now.
The year 2007 came on the heels of the all-time high in real estate values in 2006, a time that marked both the seemingly realized American Dream of universal home ownership and its turn toward its dissolution. It was a time of major change in American finances.
The year 2014 has none of these attributes. Real estate, commodities and precious metals are in bear markets, and the economy has stalled. The only thing rising is stocks.
We can therefore make a case that even 2007 was the more important market top for the average American. But we can't credit the year 2014 with anything nearly as grand as what was happening at the tops of 2000 and 2007. This lack of importance fits the b-wave label.
A Bear Market Formation Since 2000
The rest of this report is available only to Robert Prechter's free email subscribers at Elliott Wave International. You will see Prechter's analysis of an epic stock market pattern tracing out right now that has never occurred in recorded stock market history, going back 300 years -- plus its imminent and dangerous implications for investors. Read the report now to be certain your portfolio is ready. Click here.
About the Publisher, Elliott Wave International
Founded in 1979 by Robert R. Prechter Jr., Elliott Wave International (EWI) is the world's largest market forecasting firm. Its staff of full-time analysts provides 24-hour-a-day market analysis to institutional and private investors around the world.
© 2005-2022 http://www.MarketOracle.co.uk - The Market Oracle is a FREE Daily Financial Markets Analysis & Forecasting online publication.