


Gold and Silver Price Getting Set To Explode Higher
Commodities / Gold and Silver 2014 Aug 22, 2014 - 04:43 PM GMTBy: Austin_Galt

 Can you feel it? That air of desperation creeping into the mindset of the gold and silver bulls. It seems like only yesterday that the bulls were hooting and hollering and calling the next great bull market underway. Calls of "$2000 gold here we come", "$100 silver here we come". Yeehaaaa!!!
Them were the days. And I suspect those days are nearly upon us again. And these same calls will be ripped out once more. However, before that party gets started, a low is needed to end their respective pullbacks. Let's see where things stand beginning with gold.
Gold Daily Chart
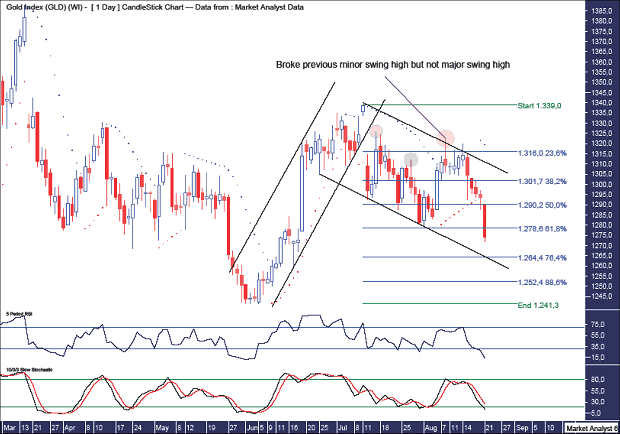
Previously, I thought gold was safe after breaking a previous swing high. Personally, I like to differentiate previous swing highs labelling some major swing highs and others minor swing highs. In this case, the minor swing high is shown in the green highlighted circle while the major swing high is shown in the yellow highlighted circle.
We can see the recent high, shown in the red highlighted circle, took out the minor swing high but failed to go on with the job by taking out the major swing high.
I have added a Parabolic Stop and Reverse (PSAR) indicator where we can see price broke support recently as seen by the dots to the downside being busted. Those dots stood at US$1292 before being taken out. This was also around the level of PSAR support on the weekly chart as shown in the last report. This was a key signal for bulls to cut long positions.
Price has now headed to new pullback lows and I have added Fibonacci retracement levels to try and determine where the pullback may eventually end. The next level is the 76.4% level at US$1264. However, considering my view that this current action is all part of a major consolidation before price heads to new lows, I won't rule out a move to the 88.6% level at US$1252. Price action within corrective patterns can be quite tricky.
I have added a Relative Strength Indicator (RSI) and Stochastic indicator and both can be seen trending down but at oversold levels. So, one might surmise that the low is just around the corner.
Finally, I have added trend lines to denote an uptrend channel and a downtrend channel. The thing that stands out to me is the impulsiveness of the trading in the uptrend channel compared to the corrective nature of trading in the downtrend channel. That is yet more evidence that price is in a little bull trend and a strong move up is surely just about upon us.
Now, let's look at the monthly chart to refresh ourselves of the bigger picture.
Gold Monthly Chart
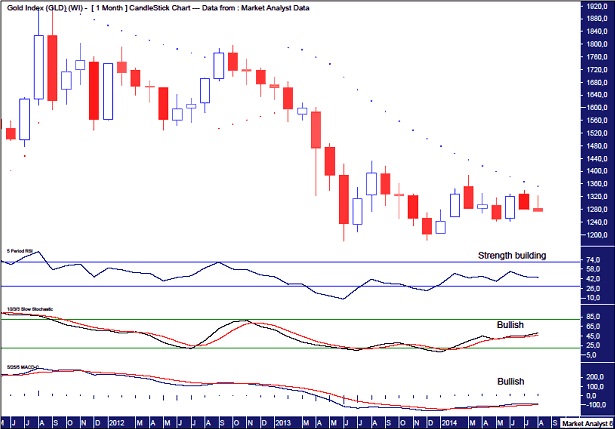
I have added a RSI which shows a pattern of higher highs and higher lows indicating strength is building.
I have also added a Stochastic indicator which shows a bullish crossover recently and is now trending up indicating overall bullishness.
And finally, I have added a Moving Average Convergence Divergence (MACD) indicator which also shows a bullish crossover recently and is indicating the probability of higher prices going forward with the blue line above the redline.
So, things appear pretty rosy for the bullish case. That may ease some nerves being exhibited by the bulls. All that is required now is for the daily chart to get in line with the monthly and then a decent rally higher can be expected.
And once that happens, I expect price to bust the upside resistance from the PSAR indicator as denoted by the dots. That would relieve some of the overall negativity. Those dots currently stand at US$1354.
Let's now move on to silver.
Silver Daily Chart
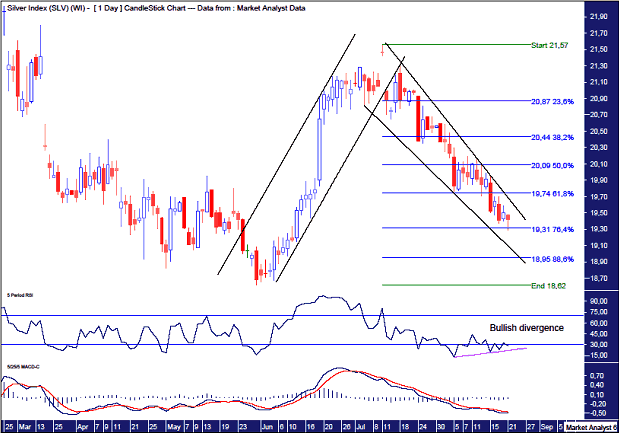
The RSI shows a little bullish divergence so a low looks close at hand.
The MACD indicator is still bearish and trending down but it is at extremely low levels so a sharp rally would not surprise here. But first we need a low. Where?
I have added Fibonacci retracement levels of the leg up from the May low to recent July high. I must admit, I didn't think price would go as low as the 76.4% level. But that is exactly where it hit today.
That may be it. I'm looking to get involved on the long side here but I just couldn't do it today. Something just doesn't feel right. I took some small long positions but when the reversal didn't eventuate today I closed them out.
Price may see a wash out down close to the 88.6% level at US$18.95 before the belated reversal higher begins. I'm watching keenly!
And as I did with the gold chart, I have also outlined the uptrend and downtrend channels. While not as apparent as the gold chart, price does look more impulsive in the uptrend channel and more corrective in the downtrend channel.
Let's reacquaint ourselves of the big picture by looking at the monthly chart.
Silver Monthly Chart
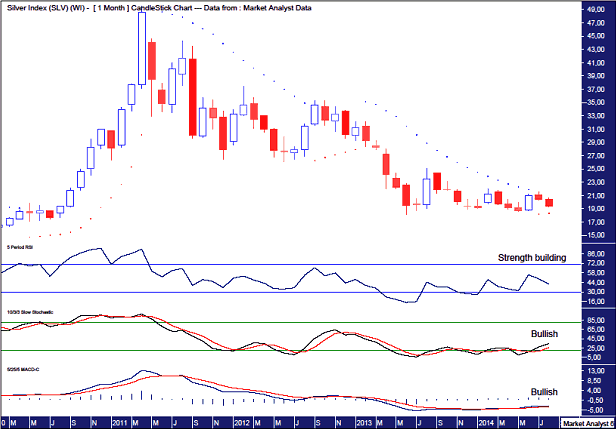
As with gold, the RSI on the silver monthly chart shows a pattern of higher highs and higher lows indicating strength is building.
The Stochastic indicator is also indicating bullishness by trending up.
And the MACD, while being at low levels, is also trending up and indicating higher prices are likely with the blue line above the red line.
And with all this evidence of bullishness, price is still only around US$19.50! That probably means something drastic is set to happen.
I have added a PSAR indicator which shows the dots to the upside being busted last month. Now it's time for the silver price to go on with the job.
I remain extremely confident that a large rally is set to occur any day now that will see both gold and silver bust their respective July highs. The coming low may see a spike down before a sharp reversal higher and may prove hard to catch. I suspect one will have to be nimble.
And by the way, I do believe we will see US$2000 gold and US$50 silver and much higher in the future. Just not yet.
Bio
I have studied charts for over 20 years and currently am a private trader. Several years ago I worked as a licensed advisor with a well known Australian stock broker. While there was an abundance of fundamental analysts there seemed to be a dearth of technical analysts, at least ones that had a reasonable idea of things. So my aim here is to provide my view of technical analysis that is both intriguing and misunderstood by many. I like to refer to it as the black magic of stock market analysis.
Please register your interest in my website coming soon. Any questions or suggestions, please contact austingalt@hotmail.com
© 2014 Copyright Austin Galt - All Rights Reserved
Disclaimer: The above is a matter of opinion provided for general information purposes only and is not intended as investment advice. Information and analysis above are derived from sources and utilising methods believed to be reliable, but we cannot accept responsibility for any losses you may incur as a result of this analysis.
© 2005-2022 http://www.MarketOracle.co.uk - The Market Oracle is a FREE Daily Financial Markets Analysis & Forecasting online publication.