


Stock Market Dow Pop And Drop Top?
Stock-Markets / Stock Markets 2014 Sep 18, 2014 - 11:20 AM GMTBy: Austin_Galt

 The Dow hit an all time high today of 17221 which occurred shortly after the Fed meeting. Many readers will know that I have been looking for a pop into top around 17200 which flushes out all the stops that had built up above the 17th July high of 17151. Recent tops in August and September would have taken out some stops but the move today would have really nailed them, so to speak.
So, with the coast now clear, it's decision time on where the Dow goes from here. Does it follow through with conviction to the upside or is it time for a healthy correction and possibly something more? Let's investigate beginning with the daily chart.
Daily Chart
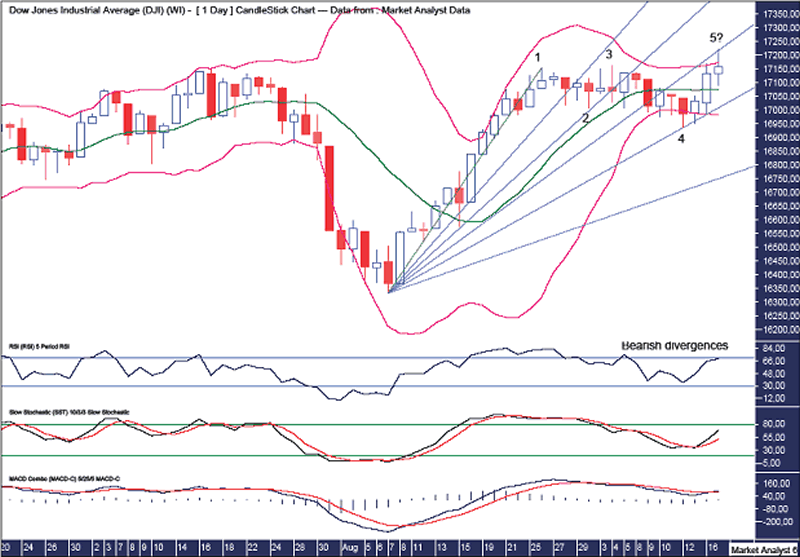
Firstly, I have added the numbers 1,2,3,4 and 5 to denote the broadening top that we've been following. Today's move to a new high may well be the final piece to the puzzle.
I have added Bollinger Bands which shows price moving away from the upper band towards the end of August. It then hit the lower band and has subsequently rallied back to the upper band in the last couple of days. This toing and froing between the lower and upper bands is consistent with a trend change in progress or a consolidation before a trend continuation. Which one is it here?
I have added a Relative Strength Indicator (RSI), Stochastic indicator and Moving Average Convergence Divergence (MACD) indicator. A top forming here would be accompanied by triple bearish divergences in all three indicators. Hmmm. I'll take a stab that this is a trend change in progress!
I have also added a Fibonacci Fan which shows this surge into a potential point 5 of the broadening top to have just clipped the 50% angle. A nice bit of symmetry there.
Also, today is 60 days from the last major top on 17th July. This is a key Gann timing period. While not the be all and end all, it is noteworthy.
Many readers will also know that there are bearish divergences on the longer term weekly and monthly charts. That hasn't changed. In fact, let's quickly look at the weekly chart containing the RSI and MACD indicator just to show the fourth bearish divergence in both indicators. A rare and extreme quadruple bearish divergence. That is providing price does indeed top here of course
Weekly Chart
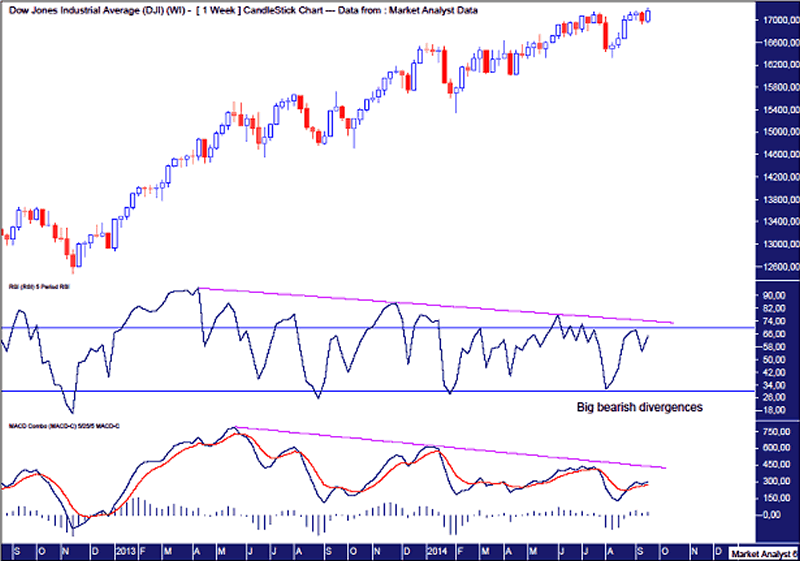
I have been looking for a pop and drop top to end this uptrend. Today looks like the pop. I have acted accordingly taking out small short positions. All that is required now is the drop which will see me add to short positions. We'll know shortly. No pun intended!
By Austin Galt
Austin Galt is The Voodoo Analyst. I have studied charts for over 20 years and am currently a private trader. Several years ago I worked as a licensed advisor with a well known Australian stock broker. While there was an abundance of fundamental analysts, there seemed to be a dearth of technical analysts. My aim here is to provide my view of technical analysis that is both intriguing and misunderstood by many. I like to refer to it as the black magic of stock market analysis.
© 2014 Copyright The Voodoo Analyst - All Rights Reserved
Disclaimer: The above is a matter of opinion provided for general information purposes only and is not intended as investment advice. Information and analysis above are derived from sources and utilising methods believed to be reliable, but we cannot accept responsibility for any losses you may incur as a result of this analysis. Individuals should consult with their personal financial advisors.
© 2005-2022 http://www.MarketOracle.co.uk - The Market Oracle is a FREE Daily Financial Markets Analysis & Forecasting online publication.