


CNNMoney.com's ‘Great Depression Comparisons Misguided' Conflicts with Historical Fact
Economics / Economic Depression May 30, 2008 - 01:28 PM GMTBy: Paul_Lamont

 After reading CNNMoney.com Editor Paul La Monica's piece on the comparisons to the Great Depression , we felt compelled to respond. Unfortunately for Mr. La Monica, the article regurgitates common beliefs about the Depression which conflict with historical fact and basic economics. We hope to set things straight. We begin with Mr. La Monica's words:
“ The unemployment rate skyrocketed during the Depression, peaking at nearly 25% in 1933. The current unemployment rate is just 5%. And that's only up from 4.5% a year ago. Contrast that with the far more explosive spike at the beginning of the Great Depression - from about 3% in 1929 to nearly 8.7% in 1930, according to the U.S. Bureau of the Census.”
These numbers are accurate. However Mr. La Monica's use of a lagging indicator for his strongest point is telling. The economy won't experience the highest unemployment numbers until it hits bottom. At that point, his commentary would be too late to be of any use.
“ Another hallmark of the Depression was deflation, which is obviously not happening today. Wages are rising - albeit by less than many would like .”
Once again we agree. Deflation was the hallmark of the Depression. But deflation is evident by the fall in the general price level, not just wages. Today a larger, more widely held asset class is falling in value than coincided with the beginning of the Great Depression. Does that mean it could be worse? The rise in wages is not good news either. According to Murray Rothbard, real wages were increasing into 1931, “thereby greatly aggravating the unemployment problem as time went on.” Perhaps this could cause the ‘explosive spike' in unemployment that Mr. La Monica first cites. He continues with a description of how different it is today:
“The main fear is inflation in the cost of food and oil. And there's reason to believe that inflation pressures may eventually ease since there is a bit of a speculative bubble going on in commodities. Plus, if the Federal Reserve can stabilize the dollar, that could cool off the recent run-up in gas and food costs.”
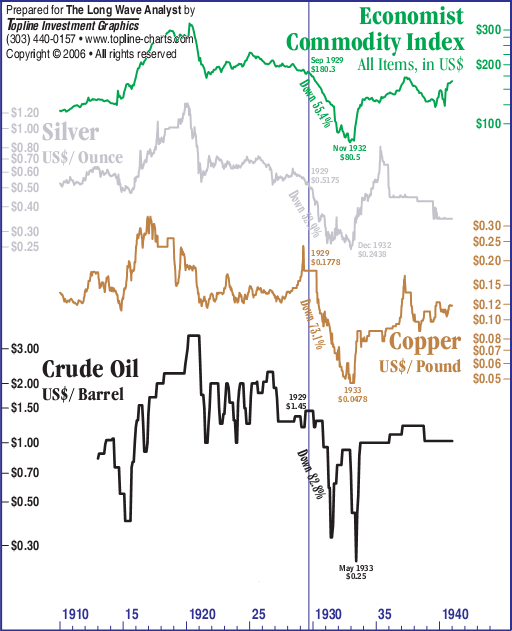
Inflation fears were the main concern during 1930-1933 as well. It was given by investors as the ‘excuse' for the U.S. corporate bond sell-off. Simultaneously, the CPI was falling. A speculative commodity bust (see chart below) and a rising U.S. dollar would also fit with the onset of the Great Depression. Mr. La Monica's analysis of today's environment could have been given in 1930.
“ Finally, there's the issue of the stock market. I've taken a lot of flack for mentioning the bounceback in stocks since many readers seem to think that what happens on Wall Street does not affect Main Street .”
This is where similarities are even more exact.

As you can see from the chart above, after the initial Crash of 1929, the DJIA bottomed out in November. Its ‘bounceback' lasted until April of 1930, (a typical .618 retracement, check your S&P500 chart of the recent rally, yes same .618 rebound) at which time it was generally accepted that the ‘worst was over.' Even Hoover remarked in a speech on December 5 th that the worst was behind them (according to Murray Rothbard, America's Great Depression ). What occurred next is related to us by Fredrick Lewis Allen in Only Yesterday :
“During the first three months of 1930 a Little Bull Market gave a very plausible imitation of the Big Bull Market. Trading became as heavy as in the golden summer of 1929, and the prices of the leading stocks actually regained more than half the ground they had lost during the debacle . For a time it seemed as if perhaps the hopeful prophets at Washington were right and prosperity was coming once more and it would be well to get in on the ground floor and make up those dismal losses of 1929. But in April this brief illusion began to sicken and die. Business reaction had set in again. By the end of the sixty-day period set for recovery by the President and his Secretary of Commerce, commodity prices were going down, production indices were going down, the stock market was taking a series of painful tumbles, and hope deferred was making the American heartsick.”
This ‘third leg of the bear market' (1930 to 1933) was characterized by the failure of the banking system to provide credit and money for the proper functioning of the economy. With bank failures currently looming , ignore history at our own peril.
Mr. La Monica continues:
“Keep in mind that the Depression was kicked into gear, if not necessarily caused, by the stock market crash of October 1929… The Depression was a product of a one-time shock that took years to recover from.”
Today's credit markets have not recovered from this ‘one-time shock' either. The main crash has already occurred in the value of real estate loans held by financial institutions. Writedowns have already totaled $380B. However rating agencies and financial guarantors have allowed bankers to prevent realization of most of the losses and subsequent forced increases in reserves. As Warren Buffet recently stated , “You've got a lot of leeway in running a bank to not tell the truth for quite a while.” According to Homer Hoyt in One Hundred Years of Land Values in Chicago ; “Real-estate loans, not failed stockbrokers' accounts, were the largest single element in the failure of 4,800 banks in the years from 1930 to 1933.” As Mr. La Monica goes onto say:
“The massive plunge in the value of an asset, in this case stocks, sent the economy spiraling into its most severe downturn in history.”
Replace ‘stocks' with ‘real estate'. Mr. La Monica then cites Chris Probyn, chief economist of Global State Street Advisors, for the reason ‘why today is different.'
“' But the Fed has cut interest rates. Congress has responded aggressively with a fiscal stimulus package,' Probyn added.' One of the problems in the Great Depression was that there was no fiscal policy employed preemptively to stop it.'”
This is easily dismissed, because it is factually incorrect. According to Murray Rothbard, before October 1929, the rediscount rate was at 6%. It was lowered to 4% in November 1929, 2% by December 1930, and finally 1.5% in mid-1931. At the same time, President Hoover “increased expenditures by $130 million of which $50 million was new construction.” State and local governments increased expenditures by $700M. The Hoover Dam began construction in 1931. Despite (relatively) greater fiscal stimulus as well as drastic rate cuts, the fractional reserve banking system collapsed in 4 years. Why? Bankers were unable or unwilling to lend, either because of continued losses on real estate loans or because of a run on deposits. The unavailability of credit and money caused the deflationary spiral of the Great Depression.
Nothing New Under The Sun
Currently, the Federal Reserve is providing banks access to half of its balance sheet as the lender of last resort. This is to keep the banking system lending. However further mortgage downgrades, financial guarantor failures or the complete use of the Federal Reserve balance sheet could force banks into crises similar to that of 1930-33.
We don't like the similarities either. But we also can't ignore them. Mr. La Monica's article represents the current widespread belief that is so commonly wrong at major market turning points.
By Paul Lamont
www.LTAdvisors.net
At Lamont Trading Advisors, we provide wealth preservation strategies for our clients. For more information, contact us . Our monthly Investment Analysis Report requires a subscription fee of $40 a month. Current subscribers are allowed to freely distribute this report with proper attribution.
***No graph, chart, formula or other device offered can in and of itself be used to make trading decisions.
Copyright © 2008Lamont Trading Advisors, Inc. Paul J. Lamont is President of Lamont Trading Advisors, Inc., a registered investment advisor in the State of Alabama . Persons in states outside of Alabama should be aware that we are relying on de minimis contact rules within their respective home state. For more information about our firm, or to receive a copy of our disclosure form ADV, please email us at advrequest@ltadvisors.net, or call (256) 850-4161.
Paul Lamont Archive |
© 2005-2022 http://www.MarketOracle.co.uk - The Market Oracle is a FREE Daily Financial Markets Analysis & Forecasting online publication.