


Stock Market Roller Coaster Start to 2015
Stock-Markets / Stock Markets 2015 Jan 10, 2015 - 04:29 PM GMTBy: Tony_Caldaro

 The first full week of 2015 starts off like a roller coaster. The market started the week at SPX 2058. After a gap down opening on Monday the market dropped to SPX 1992 by midday Tuesday. Then it rallied to SPX 2064, helped by two gap up openings, by late Thursday afternoon. Then on Friday it sold off again, hitting SPX 2038 by late morning, then ending the week at 2045. For the week the SPX/DOW were -0.60%, the NDX/NAZ were -0.45%, and the DJ World was -0.80%. Economic reports for the week were generally positive. On the uptick: auto sales, the ADP, consumer credit, wholesale inventories, the MMIS, plus the unemployment rate, weekly jobless claims and the trade deficit all improved. On the downtick: factory orders, ISM services, monthly payrolls and the WLEI. Next week will be highlighted by the FED’s Beige book, the CPI/PPI and Industrial production.
LONG TERM: bull market
Our long term count for this market remains bullish, but the market has yet to extend its long term uptrend into the sixth calendar year. Currently, after December’s all time high, it is already in its sixth year having lasted 68 months. Calendar years, however, have more of a significance in OEW terms. Historically, there have been numerous bull markets lasting 1 to 4 calendar years, three including this one lasting 5 years, one lasting 8 years, and one lasting 13 years. None lasting 6 or 7 years.

We continue to count this long term uptrend as a five primary wave Cycle [1] bull market. Primary waves I and II completed in 2011, and Primary III has been underway since then. Primary I unfolded in five Major waves, with a subdividing Major wave 1 and simple Major waves 3 and 5. Primary III is also unfolding in five Major waves, but Major wave 1 was simple and Major wave 3 has subdivided quite a bit. We have counted four of the Intermediate waves of Major wave 3, with Intermediate wave v is still underway from the SPX 1821 October low. Thus far, Intermediate wave v appears to be subdividing as well. When it does conclude Major 4 should decline about 10%. But Major wave 5 should take the market to new highs again.
MEDIUM TERM: uptrend
After the Intermediate wave iv low at SPX 1821, the market uptrended for about 1.5 months to the all time high of 2079. We labeled that Minor wave 1. A quick 5% downtrend followed into mid-December to SPX 1973: Minor wave 2. Then the market entered another uptrend: Minor wave 3. Thus far this uptrend made a new high at SPX 2094 in late-December, then pulled back nearly 5% into this Tuesday’s low. This is quite unusual for an uptrend, as we have not observed this type of action since the August 2013 to January 2014 uptrend.
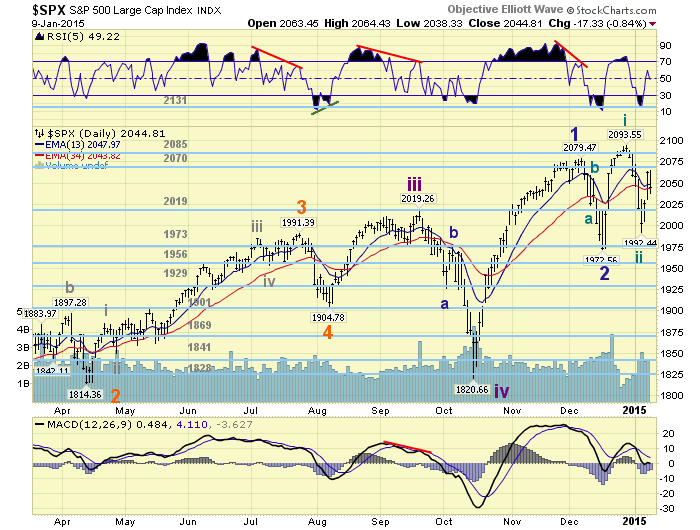
Since we have seen this type of activity before in this bull market, we favor a continuation of the uptrend. However, if the SPX drops below 1992 before making new highs then it is possible the recent SPX 1973 low was an A wave, the 2094 high a B wave, and the market is currently in a C wave of a much larger correction. We will deal with that, when and if the situation arises. For now we continue to count this uptrend as Minor wave 3. Medium term support is at the 2019 and 1973 pivots, with resistance at the 2070 and 2085 pivots.
SHORT TERM
This uptrend got off to a good start as it rallied from SPX 1973 to 2094 in only two weeks. Then we observed a nearly 5% decline to SPX 1992 by Tuesday this week. We have labeled these two waves as Minute i and ii of a five Minute wave Minor 3. The mid-week rally to SPX 2064 looks like a Micro wave 1 of Minute iii, and Friday’s pullback could be all of Micro wave 2 at SPX 2038. Should this be the situation we would expect Micro wave 3 to kick in to the upside once Micro 2 concludes.
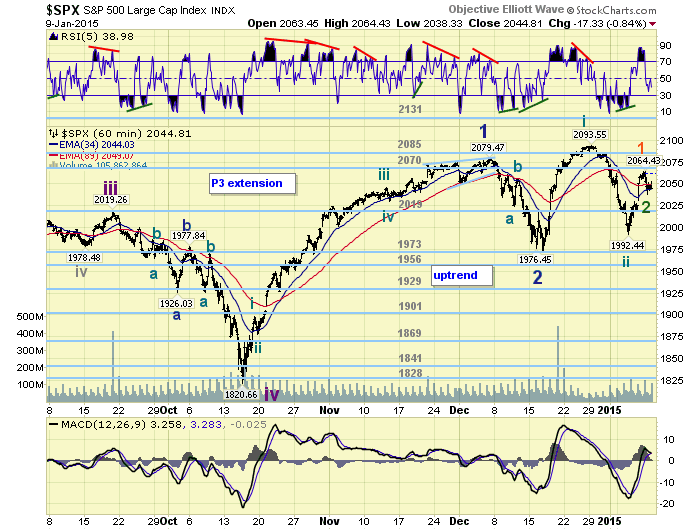
Should the market drop below SPX 2030 it is possible a retest of 1992 or lower would follow. Once the market clears SPX 2064 Micro 3 should be well underway. Short term support is at SPX 2030 and the 2019 pivot, with resistance at the 2070 and 2085 pivots. Short term momentum declined after getting extremely overbought on Thursday.
FOREIGN MARKETS
Asian markets were quite mixed on the week for a net loss of 0.3%.
European market were mostly lower for a net loss of 2.9%.
The Commodity equity group were mixed and lost 0.8%.
The DJ World index lost 0.8%.
COMMODITIES
Bonds continue to uptrend gaining 1.1% on the week.
Crude remains in a prolonged downtrend losing 8.4% on the week.
Gold is also uptrending gaining 2.2% on the week.
The USD remains in a prolonged uptrend gaining 0.8% on the week.
NEXT WEEK
Tuesday: Treasury budget. Wednesday: Retail sales, Export/Import prices, Business inventories and the FED’s beige book. Thursday: weekly Jobless claims, the PPI, and the NY/Philly FED. Friday: Industrial production, the CPI, Consumer sentiment and it is Options expiration.
CHARTS: http://stockcharts.com/public/1269446/tenpp
http://caldaroew.spaces.live.com
After about 40 years of investing in the markets one learns that the markets are constantly changing, not only in price, but in what drives the markets. In the 1960s, the Nifty Fifty were the leaders of the stock market. In the 1970s, stock selection using Technical Analysis was important, as the market stayed with a trading range for the entire decade. In the 1980s, the market finally broke out of it doldrums, as the DOW broke through 1100 in 1982, and launched the greatest bull market on record.
Sharing is an important aspect of a life. Over 100 people have joined our group, from all walks of life, covering twenty three countries across the globe. It's been the most fun I have ever had in the market. Sharing uncommon knowledge, with investors. In hope of aiding them in finding their financial independence.
Copyright © 2015 Tony Caldaro - All Rights Reserved Disclaimer: The above is a matter of opinion provided for general information purposes only and is not intended as investment advice. Information and analysis above are derived from sources and utilising methods believed to be reliable, but we cannot accept responsibility for any losses you may incur as a result of this analysis. Individuals should consult with their personal financial advisors.
Tony Caldaro Archive |
© 2005-2022 http://www.MarketOracle.co.uk - The Market Oracle is a FREE Daily Financial Markets Analysis & Forecasting online publication.