Trigger Trading- Strategic Command and Control
InvestorEducation / Learn to Trade May 31, 2008 - 03:11 PM GMTBy: Joseph_Russo
 Traders Quandary in Finding a Consistent and Accurate Edge: When considering the implied benefits of obtaining exclusive-access to a self-proclaimed, highly accurate charting service, (of which we are one) how is one to make heads or tails in turning the professed profit-packed price-charts into an actionable trading plan?
Although we receive tons of regular praise for our exemplary charting and forecasting acumen, a small but relevant percentage of users share that despite such excellence, they could not come up with an effective strategy to take advantage of our incredibly accurate price-chart landscapes.
We suspect the primary reason for such feedback is that this group of participants does not instinctively know how to apply the explicit mapping information displayed on each of our price charts. The missing ingredient for this contingent of traders is the challenge of conceptualizing and implementing tactical strategies that will align with one or more of our charts noted prospects.
As in the marketplace, and adding to this challenge, our charts point out all of the natural conflict inherent among the various strategies actively engaged in open trade. One strategy may be actively seeking to bullishly scalp 10-lots-long a defined trade-trigger targeting 10-S&P points in the next several HOURS, while another will be concurrently flat the same, and bearishly preparing to execute a counterintuitive swing trade strategy, which seeks to capture anywhere from 20-50-S&P points over the next several DAYS.
Once one grasps the logic, simplicity, and power of our charting protocol, they will find that our blended-approach to charting future price-movement is very trader-friendly, strategy specific, and designed to serve without bias, a wide variety of proven trading disciplines across all time horizons.
Case in Point:
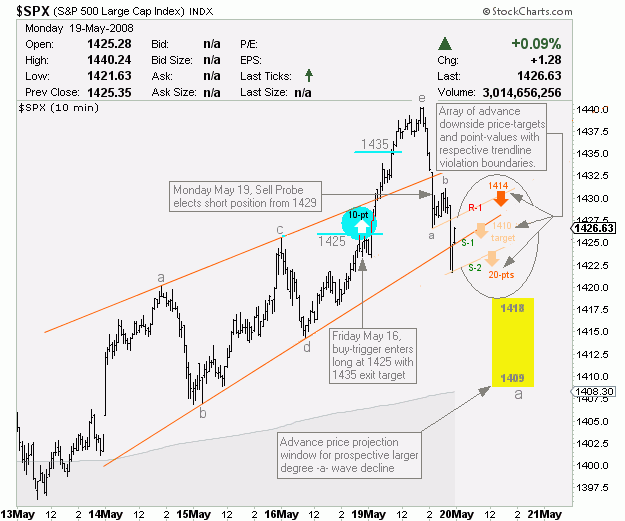
For example, back on Friday 16-May, counter-trend swing-trade strategies were on alert to deploy specific criteria in electing short positions against a forever-rising S&P since the March lows. At the same time, very short-term momentum traders employing a directional trade-trigger strategy, had the boundary lines and projected point-values to speculate on aggressive long positions from 1425 seeking a quick 10-pts of upside profits.
Below, we illustrate the immediate outcome to both strategies in the following sessions chart on 19-May, which shows our short-term bullish momentum trader quite pleased with his or her pre-planned 10-pts of profit. In addition, we quantified confirmation of short-entry for the bearish counter-trend swing- trade strategy, in which sell-probes elected at 1429. Surely, one with a great deal of experience and versatility could have made both of these trades however, it is likely that most simply focused and aligned their orders with one specific strategy or the other. One bullish, one bearish, and both successful, containing all of the essential information to execute plans well in advance, and all on the same price chart.
We also wish to direct your attention to the array of downside price-targets, and point-values already present on Monday's chart. Furthermore, we had also postulated that a small degree –c- wave decline was in progress, and provided a downside price projection-window for its terminal designated as wave “a” at one larger degree. Granted, though we have cleaned up the archived original to place special focus upon these two specific examples, the uncut chart displayed the all-of the precise information highlighted below.
Relevance to Consistent Long-Term Success:
Our unique method of charting monitors the entire spectrum of evolving strategic trade set-ups and outcomes across all time horizons and trading disciplines. Totally consumed in monitoring the progress of all active trading dynamics, we could not possibly consider trading the market ourselves without severely compromising the express focus and impartiality essential to our task.
The majority of our clients instinctively weed-through what would otherwise appear to be conflicting signals, and key off only those that are relevant to executing their individual trading strategies safely and profitably. However, there exists another contingent of traders who appear to have a great deal of difficulty distinguishing one strategy from another. It is this contingent of participants, whom we care about most deeply.
These are the “little guys.” The ones who always get their heads handed to them by the bully's dominating at the winner-take-all playground of speculation. Part of what drives us to work so hard every day, is the satisfaction we get in providing a daily arsenal of weaponry, empowering a growing army of David's' to triumph repeatedly over the endless stream of Goliaths he or she is certain to encounter on a regular basis.
Regardless of time horizon, style, or risk tolerance, without a focused tactical strategy for execution aligned with a well-conceived roadmap of relative price-direction, one will surely lose the bulk of their trading stake in no time flat.
SOLUTION:
In our never-ending quest to empower users, we have assembled clear guidelines for eight simple-to- understand trading disciplines, which we have designed specifically to take optimal advantage of our proprietary forecasting methods. These eight profit-packed trading disciplines are graded blends of extremely slow moving, and very fast moving strategies. Many of the strategies complement one another, and are ideal for use by large trading teams or individuals, while other disciplines are contrary in nature. The general guidelines for each of the disciplines are now included for continual reference in all of our NTO publications.
On the Money – Day In, and Day Out
Our last four charts will provide up-to-date example in following the performance and outcomes of our strategy-specific trade-oriented charting of the S&P through the end of last week.
Resolved : Wednesday, 21-May:
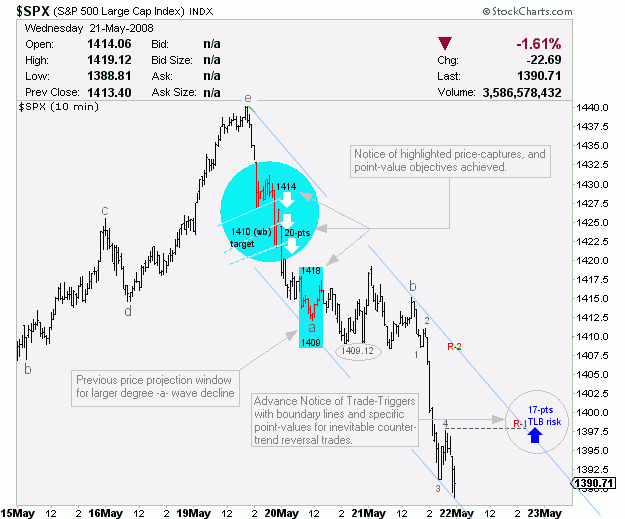
The first item of interest in this chart relative to the last is the successful price-target captures highlighted from the previous array of targets provided in advance. Each of the three down arrows, mark the specific boundaries where those employing trade-trigger strategies, had advance knowledge of actionable opportunities to sell the market with definitive point-values or price-targets defined clearly for each strategic entry.
Notice how the S&P began to consolidate, hold steady, and attempt to rally upon trading within the 1418-1409 range, which was the precise span of our short-term price projection window (noted well in advance) on the previous chart above.
Perhaps of most relevance, is the circled blue up arrow noting 17-pts of upside risk. Our constant engagement and forward vision of price action were three-steps ahead of the market in beginning to alert those wishing to deploy a counter trend trade-trigger-strategy of a pending buying opportunity setting up, all while the S&P was spinning out of control in its third day of free-fall, and nowhere near its bottom!
Such information, despite its apparent conflict, can be of extreme value to those short the market, managing recently elected swing-trade strategies. Although the short-term swing-trade strategy has specific entry and exit criteria void of association with trade-trigger strategies, gaining peripheral knowledge of what other participants are acting upon throughout the entire spectrum of tactical engagement, provides tremendous ancillary benefit for those who may be executing conflicting strategies.
Resolved : Friday, 23-May:
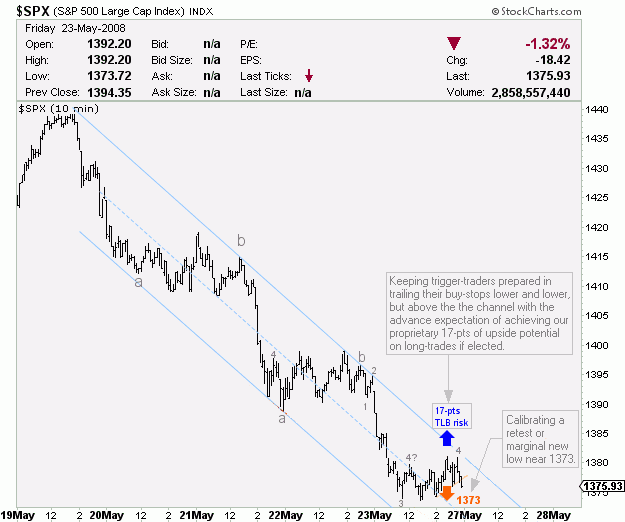
Following a second attempt to consolidate and rally on 22-May, the upper-boundary of our Elliott channel rejected this advance. The market then repeated the very same fractal (–a- -b- -c-) pattern in affecting another leg down. However, in this instance, the low on 23-May failed to test the lower Elliott channel of support.
After alerting swing-trade strategies to prepare for pending exit or SAR queues the day prior, on 23-May, proprietary tactical exit/SAR criteria was met, and swing-traders holding short positions either exited with a whopping 54-pts in S&P profits, or took similar profits and SAR'd (Stopped, and Reversed long).
Perhaps of most importance on this chart, is the attention we brought to all strategies of the likelihood of a marginal new low or retest calibrated to the 1373 level. Comprehensive advance information of this nature alerted those whose strategies called to SAR long, to expect a specific level of drawdown against their newly established long position. With this foreknowledge and insight conveyed in advance, those executing various strategies can determine how wide to set stop-losses, and if such levels are acceptable to their risk/reward matrix.
Resolved : Wednesday, 28-May:
Before we speak about our next chart, we should note that we utilize 10-minute price charts to provide magnification of the short-term price action. 30-minute price bars are the every-day charts of choice from which we convey all short-term signals, and display the larger Elliott Wave Terminals believed to be in progress. We then use daily charts for monitoring longer-term slower moving signals and strategies.
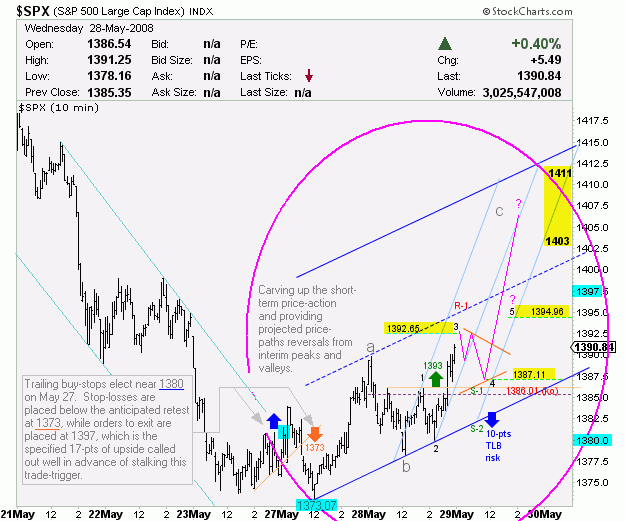
The chart below first describes the buy-side trigger entry strategy, which we made known a week in advance as depicted early on in the second chart from 21-May posted above. Of added interest is the noted calibration of fresh marginal lows to 1373.
As you can see, this trade-trigger strategy did experience 7-pts of immediate and anticipated drawdown post election. Sure, with the benefit of hindsight one could have waited for the marginal new low to occur in order to gain a better entry exactly at the bottom, however in the real world, there are no guarantees that such a retest would occur – only a modest level of anticipatory probability. It is for this reason, (no hindsight is available in real-time) that adhering to the disciplines defined in a well-conceived strategy, must be respected win, lose, or draw.
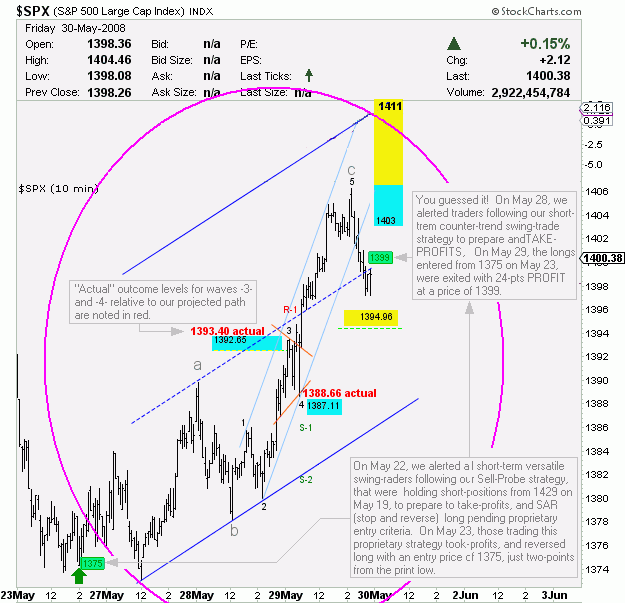
Circled in purple, is an occasional exercise we endeavor to partake in every so often. Based on our read of the wave structures at the smallest degree, we project forward the balance of anticipated terminals expected to follow the pattern through completion.
In our Evening Post for 28-May, we were observing prospects for an emerging impulse wave to the upside in its perceived third wave of advance. Prior to Thursday's open, we set forth projections for the anticipated amplitude of the third-wave in progress, along with a retracement price for the 4 th wave down, along with projections for a both a typical and extended fifth wave that would terminate the larger ‘c' wave-up believed to be underway.
We display the results of this random exercise in our very last chart.
Conclusion:
Our last chart-outcome below should speak for itself. We trust at this point that our message is clear. Patience, discipline, and a predetermined strategy of adherence in alignment with an essential edge of reliable forward-looking price projections are the most critical elements to profitable speculation and investment in all time-frames.
We continually monitor and anticipate market direction, status, and reactions to all active trading strategies with the near efficacy of Doppler radar predicting tomorrow's weather. However, we do not make recommendations to buy or sell, nor do we instruct individuals as to the management of each trade actively observed. What we do report on with alarming accuracy, is the full spectrum of trade dynamics relative to the current market structure as it relates specifically to the optimal execution of proven trading strategies.
Bear in mind that there is no perfect strategy. Contained losses are just as much a part of a successful long-term trade-plan as the big-wins that register mega-profits to ones trading account. However, navigating markets without an applied strategy and relevant edge is akin to driving blindfold on a bridge half-complete.
Come spend the summer with Elliott Wave Technology …
…And you may never again trade the indices without us-
The express focus of Elliott Wave Technology's charting and forecasting service is to anticipate price direction and the future course of broad market indices over the short, intermediate, and long-term.
Our unique blend of proprietary charting protocols are delivered daily with the express intent to convey timely information that strives to anticipate, monitor, calibrate, and observe market impact relative to a multitude of proprietary signals and triggers generated, which are in alignment with disciplines associated with eight distinct, and clearly defined discretionary trading strategies suggested by the author.
Should one have interest in acquiring access to our long-term technical analysis and/or utilizing our proprietary short-term market landscapes, we invite you to visit our web site for more information. For immediate access to our broad market coverage in all time-horizons, one may subscribe directly to the Near Term Outlook .
Trade Better / Invest Smarter...
By Joseph Russo
Chief Editor and Technical Analyst
Elliott Wave Technology
Email Author
Copyright © 2008 Elliott Wave Technology. All Rights Reserved.
Joseph Russo, presently the Publisher and Chief Market analyst for Elliott Wave Technology, has been studying Elliott Wave Theory, and the Technical Analysis of Financial Markets since 1991 and currently maintains active member status in the "Market Technicians Association." Joe continues to expand his body of knowledge through the MTA's accredited CMT program.
Joseph Russo Archive |
© 2005-2022 http://www.MarketOracle.co.uk - The Market Oracle is a FREE Daily Financial Markets Analysis & Forecasting online publication.


