


Gold and Silver Halfway Home?
Commodities / Gold and Silver 2015 Aug 11, 2015 - 08:18 AM GMT

 First off I'm on a working one week family vacation down on the panhandle of Florida which is why I didn't get to post any late Friday Night Charts. It just so happened that this week was the best week to get the family together before school starts in a couple of weeks. I will still be watching the markets and posting each day but if nothing important is happening I may knock off a little early.
I also want to thank everyone who is posting at the forum. It really is a great place to share your idea's and ask question as we have some really talented folks there. As Sir Fullgoldcrown likes to say, "It's all for one and one for all." Whatever it takes to get an edge makes no difference to me as long as we get the edge.
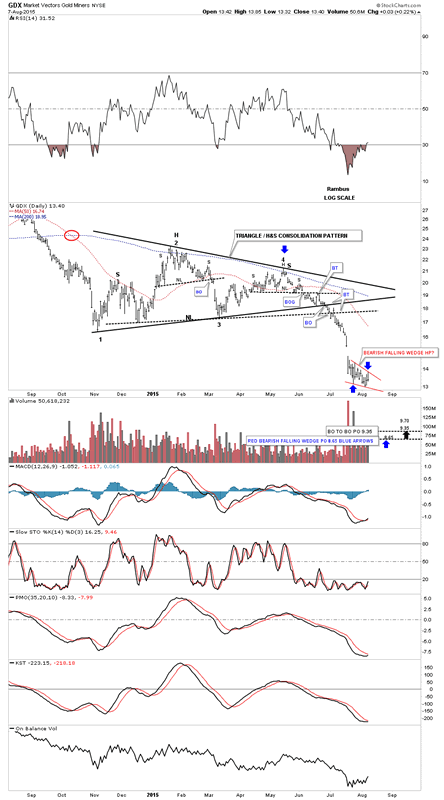
In this Report I'm going to update some charts we've been following very closely in regards to the precious metal complex. I'm going to use the GDX as a proxy for the other PM stock indexes as it shows the volume. They're all basically showing the same patterns which the combo triangle/H&S consolidation patterns as their last important consolidation pattern. There is also a very important but yet uncompleted bearish falling wedge that has been developing for the last three weeks. If there was ever a place for one of these types of patterns to form we're at that point right now. These patterns tend to show up in fast moving markets at about the halfway point in the impulse move.
I'm going to just use the combo triangle/H&S consolidation pattern and the possible little red bearish falling wedge to look for a price objective. The daily chart below is a one year look at GDX which shows the all important low that formed in November of last year. I've always viewed that November low as the beginning of the consolidation pattern on GDX that ended at the end of June and the beginning of July. Using the little red three week possible bearish falling wedge as a halfway pattern I get two price objectives based on the two different consolidation patterns. The breakout from the black triangle gives us a price objective down to the 9.35 area while the breakout from the H&S consolidation pattern gives us a little higher price objective up at the 9.70 area. There is one more price objective I can put on this daily chart using the black triangle and the possible little red bearish falling wedge as a halfway pattern. The blue arrows shows the impulse method where I take the distance from the last reversal point in the black triangle and measure down to the first reversal point in the little red falling wedge. I then take that measurement and add it to the last reversal point in the little red falling wedge which gives us a price objective a little deeper down to the 8.65 area. So, just based on these two consolidation patterns we may see some type of low between 8.65 and 9.35 or so.
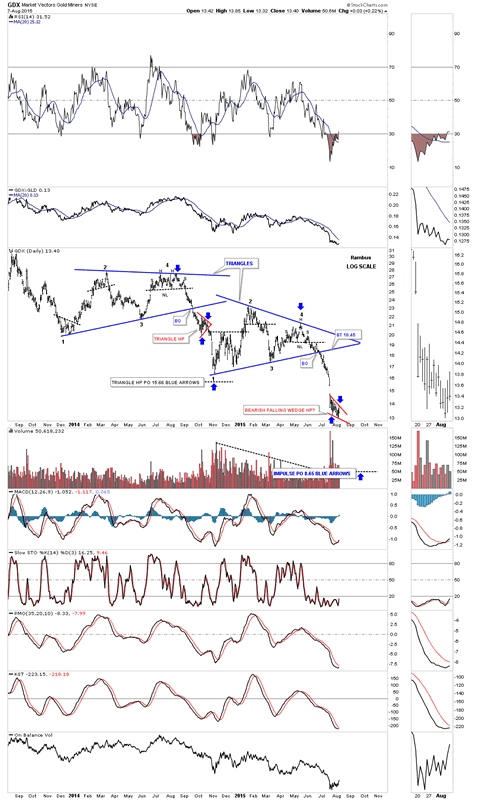
Below is a long term daily chart that shows the previous impulse move down in 2014 which shows a little red triangle as a halfway pattern. As you can see GDX failed to reach the price objective by about a point or so. Price objectives gives us a place to look for the impulse move to run out of gas or to start building out another consolidation pattern. Sometimes the price objectives can be dead on the money while other times they can be off a bit. The best way to use price objectives is to use them in conjunction with other TA such as support and resistance zones which allows you to paint a picture you can follow.
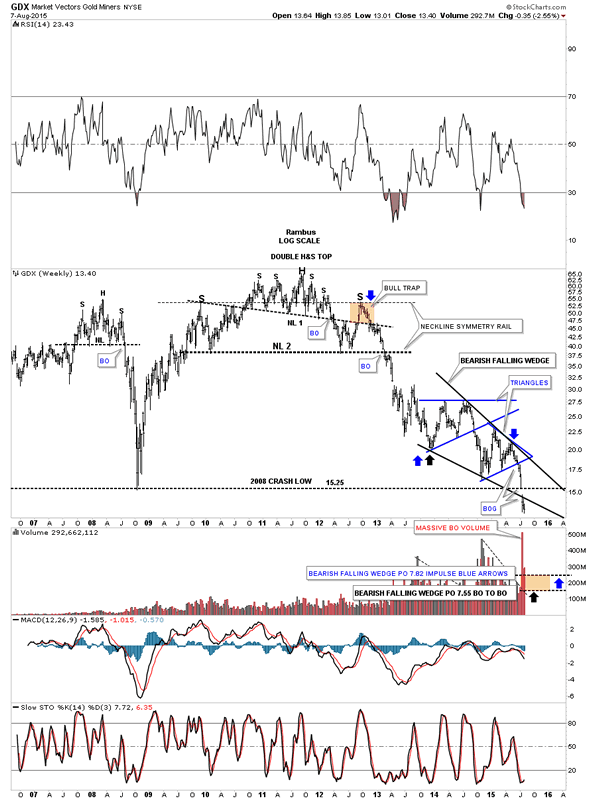
Now lets look at the long term weekly chart to gain some perspective on where we're at and how things may progress from here. This chart shows the two big topping patterns that led to massive declines once their necklines gave way. For those that knew Chartology these were money making opportunities. Back during the 2008 crash we didn't have the 3 X short etf's for the precious metals complex. I used DUG and SMN which were 2 X short etfs to play that deflationary environment at the time. It was a magical ride as very few investors seen what was about to take place and even fewer gold bugs had any idea what was about to happen. I was expecting a strong decline once the 2008 H&S top gave way but I had no idea to the extent and magnitude of decline.
Now I believe we are at another important critical juncture as we're now three weeks out of the bearish falling wedge. The breakout occurred on very heavy volume with a big breakout gap. You can see three important trendlines that the GDX had to break in order to get to where it's at right now. I've added two price objectives based on the two measuring techniques I use to give us a place to look for a low of some kind in the next several months or so. The bottom line is, from the shorter term daily charts to the longer term weekly charts the seven and a half to the nine area on GDX may give us a good place to exit our current position in DUST.
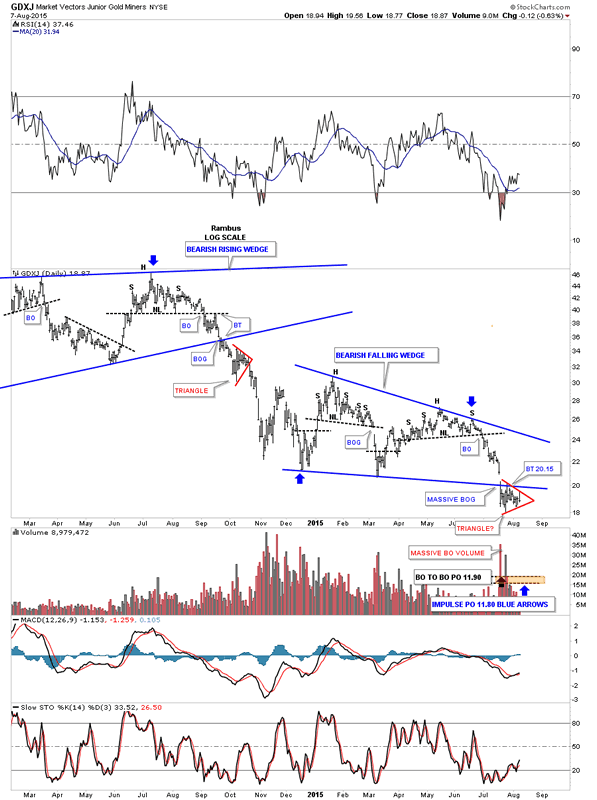
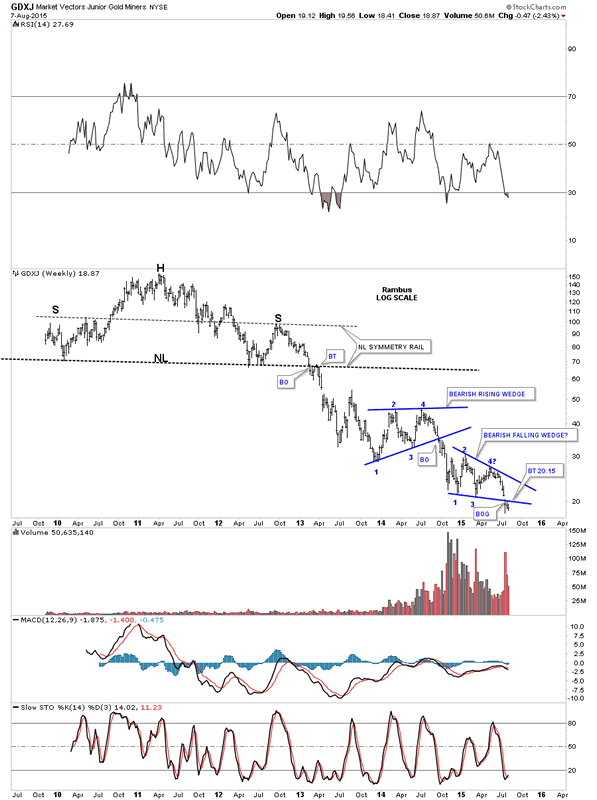
Now lets look at GDXJ which is setup just a little bit differently than the GDX. It to has two consolidation patterns the bearish rising wedge at the top and a bearish falling wedge at the bottom. Instead of the little red bearish falling wedge we looked at on the daily chart for the GDX, the GDXJ has built out a possible little red triangle consolidation pattern just below the bottom rail of the lower blue bearish falling wedge. I have shown you many examples in the past when we see a smaller consolidation pattern form just above or just below an important trendline that little pattern can give the stock the energy it needs to really begin its impulse move, in this case down. As you can see both measurements come in just below 12 even tho they're taken from two totally different areas on the chart. In order to get the next impulse move going to the downside the first thing we need to see happen is for the little red triangle consolidation pattern to break down. We're close but just not quite there yet.
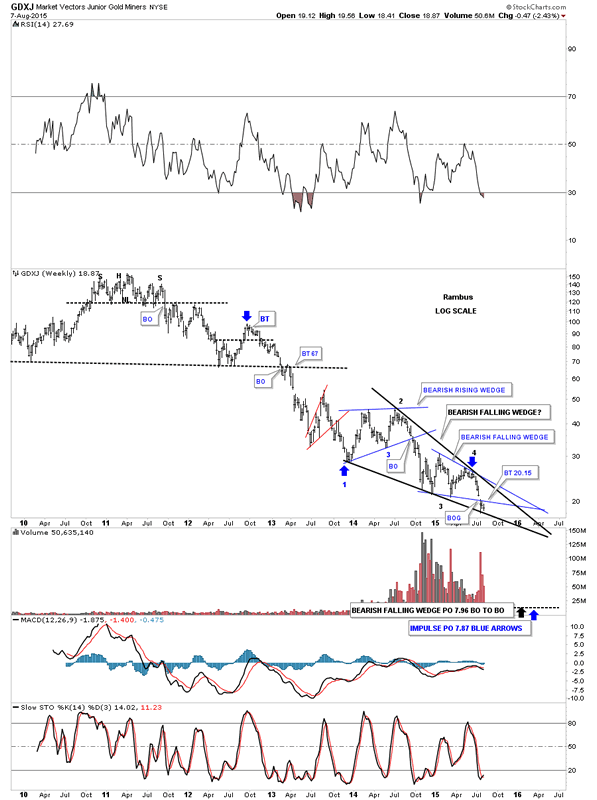
Below is a long term weekly chart for the GDXJ that shows its massive H&S top and the two blue wedges that formed one on top of the other. Again note the big breakout gap on heavy volume that accompanied the breakout of the lower bearish falling wedge. Strictly from a Chartology perspective that's exactly what you want to see. Note the breakout and backtest that took place at the neckline and the bottom rail of the bearish rising wedge that took roughly four to six weeks to complete. This week will start the fourth week of the breaking out and backtesting sequence.
Below is another weekly look at the GDXJ which shows a possible bigger bearish falling wedge similar to the one I showed you earlier on the GDX chart. Unlike the GDX, GDXJ is doing a ping pong move at the moment between the bottom rails of the two falling wedges. So far from a Chartology perspective nothing is broken yet that would call into question this possible scenario.
From a Chartology perspective everything is still lined up for at least one more impulse move lower over the next month or two. It has been a long four year bear market that may be coming to an end if these charts play out. As always there are no guarantees what the future holds but one thing I can assure you of is that I'll be following the price action for clues on what is happening in this once loved sector.
All the best
Gary (for Rambus Chartology)
FREE TRIAL - http://rambus1.com/?page_id=10
© 2015 Copyright Rambus- All Rights Reserved
Disclaimer: The above is a matter of opinion provided for general information purposes only and is not intended as investment advice. Information and analysis above are derived from sources and utilising methods believed to be reliable, but we cannot accept responsibility for any losses you may incur as a result of this analysis. Individuals should consult with their personal financial advisors.
© 2005-2022 http://www.MarketOracle.co.uk - The Market Oracle is a FREE Daily Financial Markets Analysis & Forecasting online publication.