


Your Decisive Stock Market Plan to Follow Whilst Most Investors Shiver With Fear
Stock-Markets / Stock Markets 2015 Sep 01, 2015 - 12:42 PM GMTBy: ...

MoneyMorning.com  Shah Gilani writes: Make no mistake about it: The stock market crashed last Monday.
And it was terrifying.
It was frightening.
Stocks bounced on Wednesday and Thursday, with the Dow Jones Industrial Average gaining back more than 1,000 points.
Now investors want to know: Was last Monday’s doubling over a below-the-belt hit?
Was Tuesday’s cheap shot just a phantom blow?
Was the rally back Wednesday and Thursday an “all clear” signal?
Was Friday’s action indicative of anything?
Here’s the truth about last week, what’s going to happen next and what you should do…
Setting the Scene
Let’s look at the market conditions heading into last week.
Stocks had been weak. It had been hard to tell from the sideways action exhibited by the major averages, but beneath the headline numbers more than half of all stocks were trading below their 50-day moving averages.
Indeed, even before Monday’s tumble a lot of stocks had dipped below their 200-day moving averages.
While being above a 50-day moving average (the average price a stock has been trading over the past 50 days) is a positive sign – and falling below a 50-day average is a warning sign – share prices breaking below their 200-day moving average is a flashing red light.
Red lights are now everywhere.
There had been profit-taking toward the end of the previous week. That tipped the balance between investors thinking we would break higher from the sideways trend and investors who saw lackluster action as a reason to take profits off the table.
With bulls and bears facing off in this sideways market, the backstory had become China.
Economic growth in China has been slowing, and Chinese stocks had been getting killed. When U.S. investors woke up last Monday morning and saw the Shanghai Composite Index down 8.5%, they panicked.
Speculators, sensing the market’s weakness going into the previous weekend and seeing Chinese stocks collapsing before U.S. markets opened last Monday, shorted Standard & Poor’s 500 Index futures at a furious pace. Institutional money managers didn’t hesitate to jump on the bandwagon. Before markets opened, the futures rout indicated that the bellwether Dow Jones would open more than 1,000 points down.
And that’s what happened. At the open, the Dow dropped more than a 1,000 points, for the first time in history. But what really happened was worse.
Much worse.
Last Monday’s market plunge started out as a story about China, but ended up being about the mispricing of exchange-traded funds (ETFs) and mutual funds, and stop-loss orders getting triggered when they shouldn’t have been. It’s about how high-frequency traders have turned exchanges into casinos, how the markets are truly broken and how it’s only a matter of time before they implode and take the economy down with them.
But the bottom line here – the real bottom line – is that is all about you and your money.
Markets are tired. Stocks are weak. That’s the backdrop.
There’s no good news anywhere. The U.S. had an upward gross-domestic-product (GDP) revision indicating 3.7% growth for the second quarter, but the economy grew at an annual rate of only 2.2% in the first half of the year.
Europe is slipping backward again. China is sinking in quicksand and could turn monstrously ugly. Japan is foundering. Oil and commodities are depressed and telling us there’s no demand… no growth anywhere.
Against such a moribund backdrop, when stocks collapse – establishing new lows below their 200-day moving averages – and then bounce, it’s those new lows that traders and investors fear.
And they should fear them.
All those lows that stocks and markets just made now represent the path of least resistance. Any and every bounce we experience – if they don’t end up being “consolidating moves” from which stocks can go higher – are nothing but ledges that stocks can fall from to test those lows.
That happens. It’s not technical mumbo jumbo, or tea-leaf reading.
It’s psychological.
And that – market psychology – is what technical analysis is really about.
Investors see new lows and recognize them for what they are: levels stocks fell to because investors panicked and sold there. If a stock or market looks like it’s weakening, investors who saw new lows and still own stocks – or who bought near those lows – face the fear that since selling created those lows before, anyone holding stock above those levels would consider selling before stocks work themselves back down to those levels.
It can become self-fulfilling.
Even scarier is the investor psychology that festers around these new lows – a sentiment of “What if they don’t hold?”
If new lows can be made, and they always can be, then there’s no known bottom, other than the next support levels below the last lows.
That’s where we are right now. The path of least resistance is back down to those lows.
I’m not trying to scare you. I’m trying to prepare you.
But what if I’m wrong? Maybe this panic will pass and we’ll move higher. In which case I’ll have covered your backside and tell you the coast is clear and it’s time to load up.
But if I’m right, and I am most of the time, you’re going to need a plan. As for that claim of “being right” – sorry, but I have to boast a bit here: I called this last sell-off, and we just closed out six triple-digit winners (each one of them a good bit more than 100%) on downside trades we had just put on in my Short-Side Fortunes newsletter.
So keep it simple.
Charting the Market
If markets bounce higher from here – and the jury’s out on that happening – the first thing you need to know is where the market’s “support levels” were… and if those support levels held.
That means you have to employ a bit of “technical analysis” – to look at charts and establish where support was and if markets didn’t hold support. And if none of those levels held, how low did stocks fall?
Then, because markets are more important than stocks – because even the best stocks fall from the weight of crashing markets – you have to know where all the support levels were for all your individual holdings and how low below support they just went.
The reason support is important for the markets – and for your stocks – is something I refer to as the “horizon line.” (I call it a horizon because when you draw your support lines they are usually straight horizontal lines.) That’s a place where stocks have come down to before – usually several times, in fact – only to bounce higher from there. The psychology of this is important, because investor psychology is what technical analysis is all about.
When investors see stocks approach support levels, several things can happen. Some investors might see it as a chance to add to existing positions. Others might view that level as a good point to create a new position – expecting support to hold and stocks to rally.
If support gets broken, it becomes scary for holders of the stock. There’s now a good chance that investors might dump their positions – reasoning it’s safer to sit out the selling they now believe could follow.
That horizon/support line is also the line where traders – a group that sometimes includes me – will test shorting the stock or market because we know if support gets broken, and sellers dump stocks there, we can make money being short.
Support lines are the single-most-important technical analysis tool in everyone’s toolbox. If you have zero interest in technical analysis (a big mistake, in my opinion), at least watch your support horizons.
The reason you have to know how far below stocks and markets fall once “support levels” are breached is this: Very often, the newly established low becomes the path of least resistance that shares will fall back to if stocks attempt to rally – only to sputter and fall backward again.
Take a look at the accompanying Dow chart.
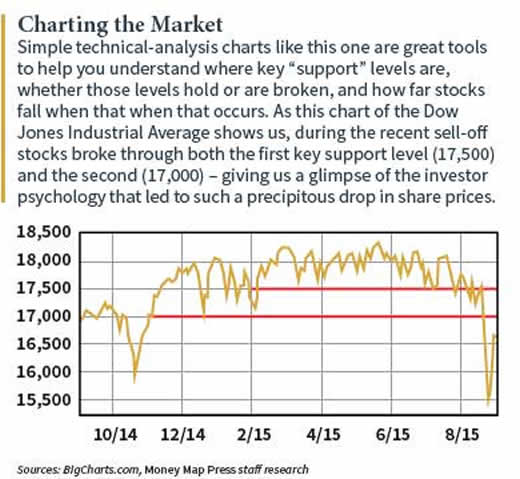
Notice the first horizon/support line at 17,500. We broke that. Then we broke through the next major support at 17,000.
Now look at the new low established at 15,370. That’s now the path of least resistance – until the market gets back above the old support horizon of 17,000, and then above 17,500 very quickly after we get above 17,000.
Down is now the path of least resistance because those two old support lines are now the Dow’s first and then second “resistance lines” – the “ceiling” the Dow has to break back above for investor psychology to improve.
If resistance is pierced, investors feel like the selling is over. The markets are in better shape because they bounced back through resistance. The coast is clearer, so to speak, and getting back in is now worth the risk.
A Path to Follow
If we go higher – but don’t break through resistance (we may not even get close to it) – I’m recommending you add downside plays (shorts, put options or inverse funds that gain in value when stocks fall) to your portfolio. I’m also recommending you look to hedge your individual stock positions if you’re sticking with them.
Consider buying some put options on those positions. Remember, puts will get cheaper if stocks bounce higher.
On the other hand, if markets fall, puts will become increasingly expensive as more and more investors rush to them for protection. (And if you bought those puts when they got cheaper as markets rallied, you’ll really gain as those options rise sharply in value as markets careen lower.)
I’m telling you to do this for a reason. At many of those pivot levels, you’ll often see long investors try and make shorts cover and push stocks higher. Sometimes that works as some of those short players panic and cover their positions.
But if there’s no follow-through after any of these upside pops, you know there are no real buyers – meaning we’re headed right back down.
On any of the new downside positions you’re going to put on, use a 10% stop to get out if we get a huge rally and have to reassess our plans.
Some good downside positions to consider buying include “inverse ETFs” like the ProShares Short QQQ (NYSE: PSQ) and ProShares Short Dow30 (NYSE: DOG). These inverse plays will give you protection – and profits – should markets fall.
If stocks sell off hard, don’t be afraid to use market orders to buy into these inverse ETFs. Once you have your position, use 10% stop-loss orders to get out of the way if there are any crazy updrafts like we saw last Wednesday and Thursday.
Let me know if this is helpful, or what else I can do to help you navigate this stretch… in case market shadows grow darker.
Money Morning/The Money Map Report
©2015 Monument Street Publishing. All Rights Reserved. Protected by copyright laws of the United States and international treaties. Any reproduction, copying, or redistribution (electronic or otherwise, including on the world wide web), of content from this website, in whole or in part, is strictly prohibited without the express written permission of Monument Street Publishing. 105 West Monument Street, Baltimore MD 21201, Email: customerservice@moneymorning.com
Disclaimer: Nothing published by Money Morning should be considered personalized investment advice. Although our employees may answer your general customer service questions, they are not licensed under securities laws to address your particular investment situation. No communication by our employees to you should be deemed as personalized investent advice. We expressly forbid our writers from having a financial interest in any security recommended to our readers. All of our employees and agents must wait 24 hours after on-line publication, or after the mailing of printed-only publication prior to following an initial recommendation. Any investments recommended by Money Morning should be made only after consulting with your investment advisor and only after reviewing the prospectus or financial statements of the company.
© 2005-2022 http://www.MarketOracle.co.uk - The Market Oracle is a FREE Daily Financial Markets Analysis & Forecasting online publication.