


Silver: The “Five Year Plan” and the Great Leap Forward
Commodities / Gold and Silver 2016 Apr 28, 2016 - 03:57 PM GMTBy: DeviantInvestor

 Five years ago paper silver contracts on the COMEX hit a multi-decade high over $48 on April 29, 2011.
At the end of April 2016 the silver price is bouncing around $17, down about 65% from its April 2011 high. The low occurred at about $13.60 in December of last year, when paper silver prices were down about 70% from their April 2011 high.
Let’s review significant prices roughly every five years back for 30 years:
Date Low Price High Price Comment
Dec 2015 13.60 Major low
Apr 2011 48.58 Multi-decade high
May 2006 15.20 Multi-decade high
Nov 2001 4.01 Ten year low
Jly 1997 4.18 Low
Feb 1991 3.50
Apr 1987 9.79
Examine the following log-scale graph of COMEX silver. The red lines are 4.75 years apart. The green line shows a long term exponential trend upward.
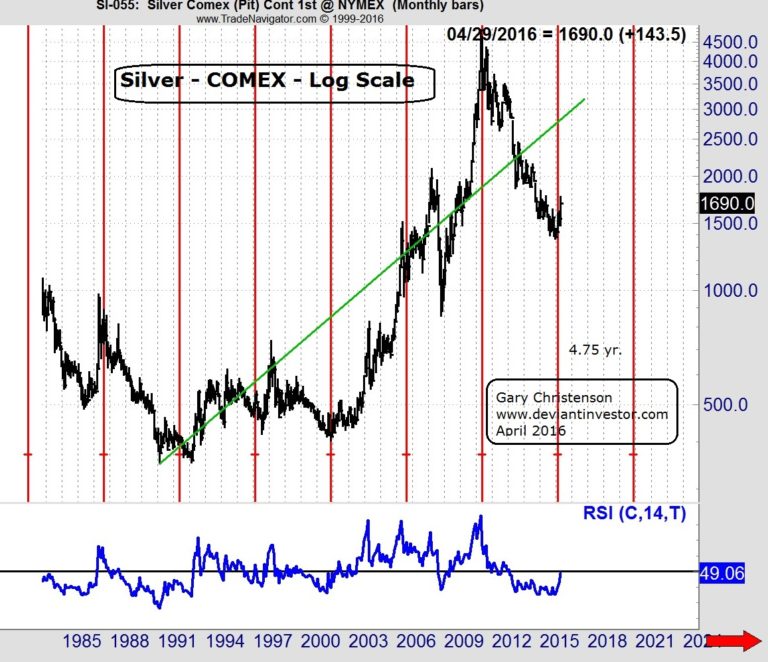
What this tells us:
- Silver prices trend upward exponentially, in the long term, just like debt, military expenses, prices for potatoes, cigarettes, devaluation of fiat currencies, the S&P 500 Index, and expenditures to purchase a Presidency.
- An important high occurred in 2011, and an equally significant low occurred in December 2015.
- The December low was about half the exponential trend price and the April 2011 high was about double the exponential trend price. Silver prices rise to extremes, and then fall to crazy lows.
- The December 2015 low may have been the lowest silver price for a very long time, given the ongoing devaluation of currencies, Chinese physical markets that will compete with the COMEX, the incredible debt that doubles about every eight years, the increasing investment demand for silver and weakening supply, and the price suppression during the past three years.
WHAT WE KNOW FOR CERTAIN:
- Central banks want inflation and devaluation of their currencies. One way or another they are likely to create price inflation since they own multiple “printing presses.” The results, for all but the elite, will be ugly.
- Central banks abhor deflation. They will do whatever is necessary to avoid deflation. They are likely to succeed, thanks to their “printing presses.”
- Governments want inflation and higher taxes. They hate deflation and lower taxes. Governments exist to spend money – more and more money. The US national debt has increased from $3 billion in 1913 to nearly $20,000 billion today. Expect government deficit spending and dollar devaluation to continue, along with higher prices for what we need to live.
- The inevitable consequences of deficit spending, currency devaluations, central bank “printing,” and politicians being politicians is higher prices – exponentially higher prices. Look at the exponential trend line in silver prices that runs from about $3.50 in 1991 to about $30 in 2016.
CONCLUSIONS:
- Silver prices hit an important low in December 2015. Expect a “great leap forward” in prices during the next five years.
- Silver prices are “managed” by several powerful groups. Expect volatility. In simple terms, the sequence is: Run prices up, suck in investors near the top, increase margins, crash prices by selling heavily with paper contracts, disillusion the “amateurs,” Goldman announces “research” that indicates silver and gold will fall for several years, allow a small rally, force prices down again, big traders cover shorts, margins are reduced, more “bad” news is distributed on silver, and the large players begin buying while small investors are disgusted and beaten down by silver “management,” … and the cycle repeats.
- Central bankers will do what they do – devalue the currencies and “print” as much as possible to benefit themselves and the financial and political elite. This will increase silver prices.
- Politicians will do what they do – spend money and increase debt. This will increase silver prices.
- Large traders will do what they do – push prices higher and then crash them lower. The low occurred in December 2015 – expect higher silver prices for several, probably many years.
- Stackers will do what they do – buy, stack, and wait. They see the big picture. Silver prices (kitco.com) during the past 100 years:
1913 $0.58 Fed Reserve created
1953 $0.85
1973 $3.14
1980 $50.00 High
1983 $9.12
1993 $4.57
2003 $4.88
2011 $48.50 High
2013 $23.79
2015 $13.82 Low
Late April 2016 $17.00
- Silver prices will move upward to $50 and eventually to $100. Depending upon the degree of dollar devaluation, how much “money printing” occurs, the loss of dollar reserve currency status, hyperinflation, importance of the Chinese physical exchanges, and much more … silver prices could race far higher than $100. We shall see …
Read: Nine Meals from Anarchy.
Subscribe to NFTRH Premium for your 25-35 page weekly report, interim updates (including Key ETF charts) and NFTRH+ chart and trade ideas or the free eLetter for an introduction to our work. Or simply keep up to date with plenty of public content at NFTRH.com and Biiwii.com.
By Gary Tanashian
© 2016 Copyright Gary Tanashian - All Rights Reserved
Disclaimer: The above is a matter of opinion provided for general information purposes only and is not intended as investment advice. Information and analysis above are derived from sources and utilising methods believed to be reliable, but we cannot accept responsibility for any losses you may incur as a result of this analysis. Individuals should consult with their personal financial advisors.
Gary Tanashian Archive |
© 2005-2022 http://www.MarketOracle.co.uk - The Market Oracle is a FREE Daily Financial Markets Analysis & Forecasting online publication.