


Fed Stance Likely to Pressure US Dollar, GBP Chart View
Currencies / US Dollar Jun 08, 2016 - 03:21 PM GMTBy: Richard_Cox

 Financial markets always have an overriding story and if we look at the news headlines that have been generated over the last few months, we can see that the focus is once again back on the Federal Reserve. Market opinions are still sharply divided: If incoming data is consistent with labor market conditions strengthening, an interest rate hike could be foreseen sooner than we think.
Fed Reserve Chair Janet Yellen addressed an attentive crowd on Monday, sharing her outlook on the U.S. economy and hinting toward a possible rate hike. But at the same time it appeared as though she was carefully avoiding any questions that would clarify a timetable. In a fairly optimistic speech, she stressed on the point that positive forces supporting employment and inflation will continue to surpass the negatives. Although, last month’s job reports were no less than ghastly, and policymakers are still determining whether the data is consistent enough to impact decisions for medium or long term policy changes.
Market Response in Stocks and USD
Despite of all the assurances, stocks are struggling to keep up. Markets had lost faith in a fed rate hike this summer, and let the news support stock prices for what should be considered as an extended period of time. So, the hope of an interest rate hike in “coming months” should get investors out of their depressing slumbers.
After the Yellen speech stocks rose to close at 2,110, which marked a new closing high for 2016. This could mean that the Fed hiking rates (or even not hiking rates) tends to have little impact on the overall bullish trajectory. Does the market have a clear incentive? Or is this just an unanswerable puzzle? It is more likely that this is why many market strategists and economists claim that the market is more or less neutral -- largely rangebound and most investors are patiently waiting to buy the slump as soon as there is even a 5% dip.
According to some market strategist, the market could remain confined in a range between 2,088 and 2,120 as there are clouds of confusion around the economic data right now. Unless those clouds clear off, and we could see convincing and consistent data around employment and inflation to say at the least, a silver lining is far from visible. In the midst of it all, Yellen’s cautiously optimistic stand on the economic outlook will likely set market expectations in a positive direction for the next few months.
Chart View: GBP/USD
The best market indicator when assessing the impact of these actions is the USD. To better assess what is actually happening in USD trends it is a good idea to look at the GBP/USD, which is one of the more volatile examples of the major trading pairs in foreign exchange. The pair is often a leading indicator because of its higher volatility levels.
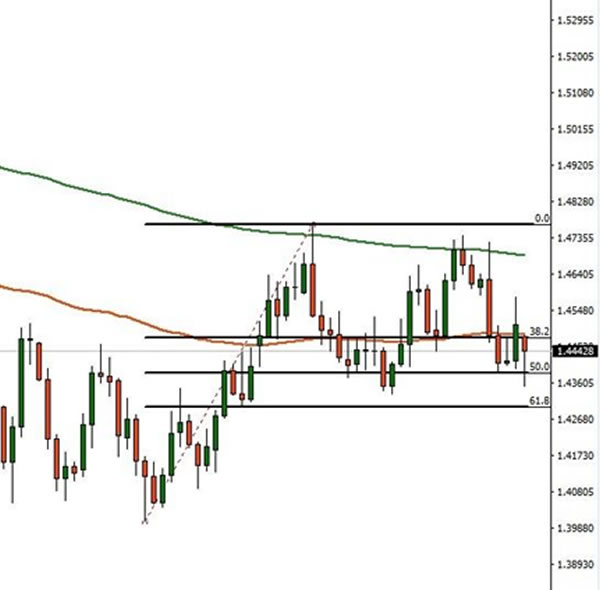
Key Resistance: 1.4730
Medium Resistance: 1.4483 (38.2% fibo and 100 day MA)
Buying Zone: A clear break of the 38.2% fibo will trigger the buy trade
Selling Zone: A clear break of 1.4300 level will trigger the sell trade (61.8% fibo)
Trading stance: Investors likely to look for buying opportunities with the clear break of the 100-day MA and price action confirmation.
The medium-term uptrend in the daily chart is still intact. However the current price is significantly close to 100-day MA and 38.2% fibo, which argues against taking new long positions. Traders will likely wait patiently for the market to break the 1.4483 resistance level in order to initiate new long setups. These moves are seen in live currency rates and a clear break of the medium-term resistance level will start the pair towards key resistance levels at 1.4730. On the contrary, a decisive break of the 1.4300 level will bring selling pressure until the pair moves back towards the 1.4000 psychological level.
By Richard Cox
© 2016 Richard Cox - All Rights Reserved
Disclaimer: The above is a matter of opinion provided for general information purposes only and is not intended as investment advice. Information and analysis above are derived from sources and utilising methods believed to be reliable, but we cannot accept responsibility for any losses you may incur as a result of this analysis. Individuals should consult with their personal financial advisors.
© 2005-2022 http://www.MarketOracle.co.uk - The Market Oracle is a FREE Daily Financial Markets Analysis & Forecasting online publication.