


Stock Market Volatility Continues
Stock-Markets / Stock Markets 2016 Jul 02, 2016 - 12:35 PM GMTBy: Tony_Caldaro

 The market started the week at SPX 2037. After a gap down opening to start the week, and a decline to SPX 1992, the market reversed and rallied quite strongly for the rest of the week. The two day post Br-exit decline from SPX 2113-1992, was nearly fully retraced when the market hit SPX 2109 on Friday. For the week the SPX/DOW gained 3.2%, and the NDX/NAZ gained 3.4%. Economic reports for the week were positive. On the downtick: pending home sales, construction spending, plus weekly jobless claims and the trade deficit rose. On the uptick: Q1 GDP, consumer confidence, personal income/spending, the PCE, the Chicago PMI and ISM manufacturing. Next week’s reports will be highlighted by monthly Payrolls and the FOMC minutes.
LONG TERM: neutral
Took a look at the history of the DOW from 1900-present. Found two periods when the DOW confirmed a bear market, then spent over one year flirting with potential new highs. The two instances are of different wave degrees, but are similar to the current market we have been experiencing since the May 2015 high.
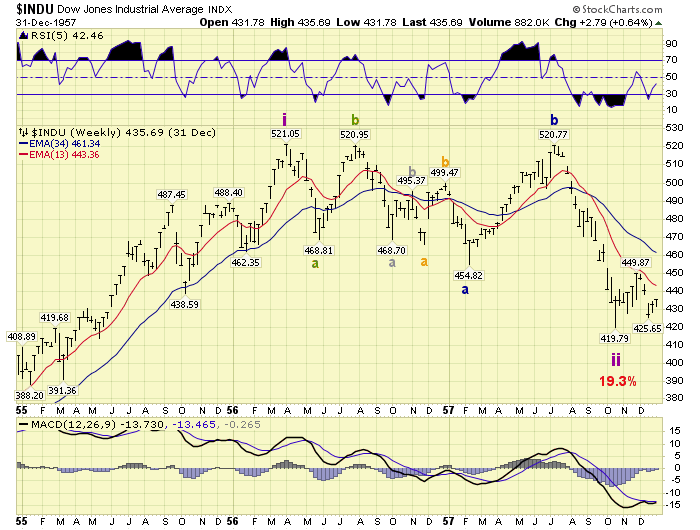
The first one is the 1956-1957 bear market. After a three year bull market in which the DOW doubled, the market spent 15 months attempting to make new highs. Notice it had four uptrends during that period, and all failed to make new highs. Then after failing on its last, and strongest, attempt it broke to lower lows.
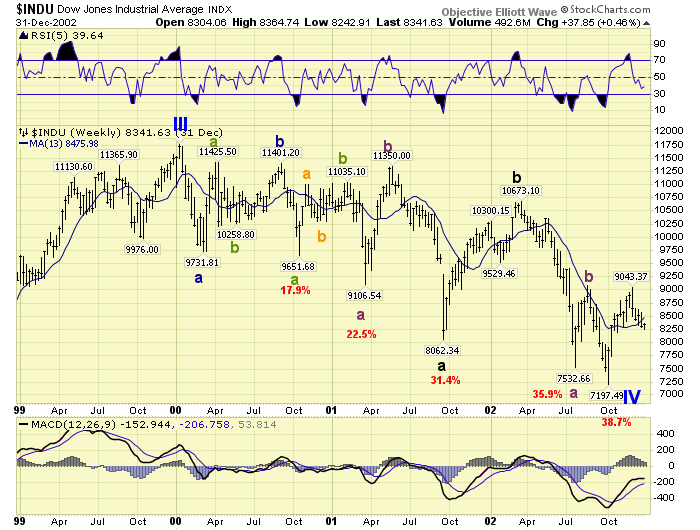
The second one is the 2000-2002 bear market. This bear market followed an extraordinary, record breaking, 13-year bull market when the DOW rose from 1,616 – 11,750. Notice after the top it had five uptrends during the following 16 month period, and all failed to make new highs as well. Then after failing on its last attempt, and strongest, it broke to lower lows.
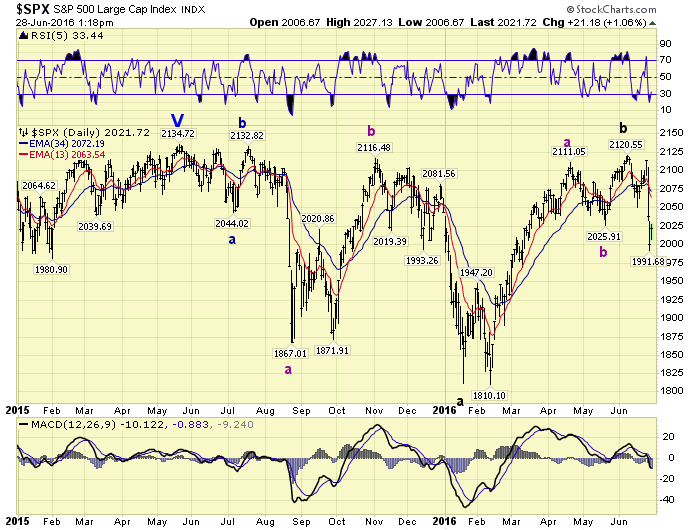
Our current market has done something quite similar. After a six year bull market in which the SPX tripled, the market has spent the last 13 months attempting to make new highs. Notice since the May 2015 high at SPX 2135 the market has had four uptrend attempts to make new highs and all have fallen short: 2133, 2116, 2111 and 2121. Until the market breaks through to new highs we remain long term neutral.
MEDIUM TERM: uptrend probably underway
This weeks activity generated a WROC signal. These signals usually occur before OEW confirms and uptrend, and are 96% accurate during bull markets. During bear markets the accuracy drops to about 75%, as some bear market rallies can trigger WROC signals. As a result probabilities suggest an uptrend is now underway.
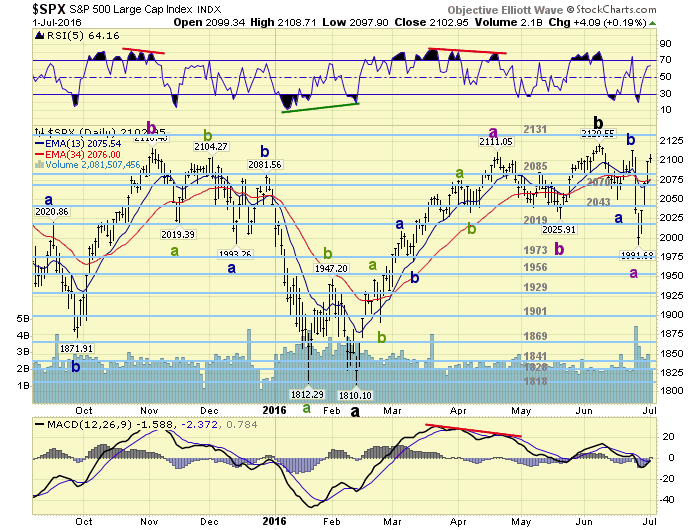
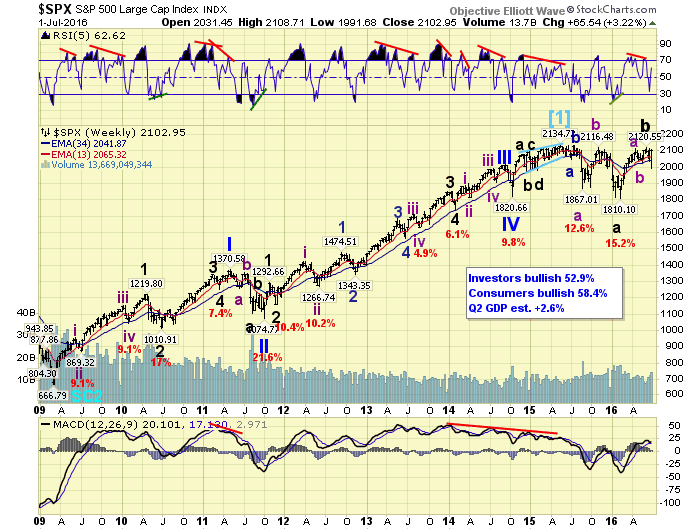
We continue to count the three wave advance from SPX 1810-2121 as an a-b-c Major wave B. The recent decline to SPX 1992 should have started Major wave C. But the market rallied strongly this week, nearly retracing that entire decline. Should the market confirm an uptrend, and exceed the actual SPX 2135 all time high, then Major wave B is probably subdividing and extending. This would also suggest Primary wave V is underway in the NYSE index.
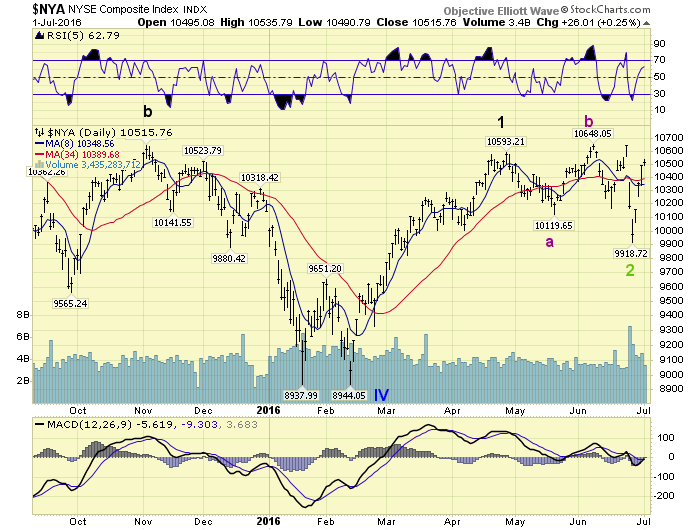
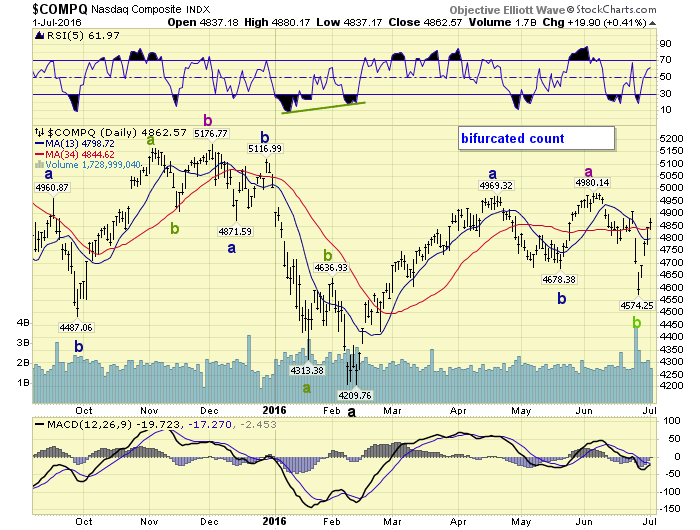
As we have been noting for a couple of months now. A Primary V in the NYSE to new highs, and an irregular Major wave B in the four major indices, would put all five of these indices back in alignment. Even though the SPX/DOW/NDX/NAZ would be labeled B wave advances. The NAZ daily chart is carrying this potential subdividing/extending Major wave B count. Medium term support is at the 2085 and 2070 pivots, with resistance at the 2131 pivot.
SHORT TERM
The market has been quite volatile since the June uptrend high at SPX 2121. The market first declined to SPX 2050, rallied all the way back to SPX 2113, then declined to SPX 1992 just this Monday. We labeled that decline with three Minor waves creating Intermediate wave A. Then from Monday’s low to Friday the market rallied back to SPX 2109. We had anticipated an Intermediate wave B rally if the market cleared the 2043 pivot. But thought the rally would be limited to the 2085 pivot range. When there wasn’t even a notable pullback at that area we knew the market was heading higher.
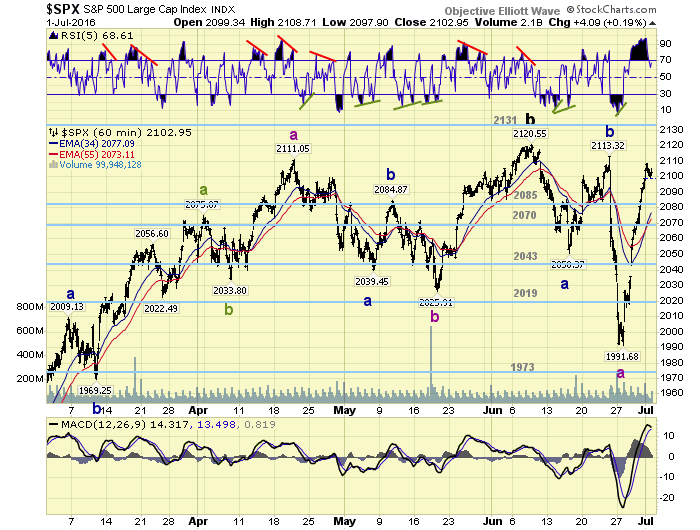
Thus far we can count four waves up from the SPX 1992 low: 2027-2016-2109-2099. Should the market rally back to SPX 2109, or higher, then the entire rally would look impulsive. If not, then it is just another corrective rally in this ongoing choppy market. With US markets closed on Monday anything is possible by time it opens again on Tuesday. Short term support is at the 2085 and 2070 pivots, with resistance SPX 2113 and SPX 2121. Short term momentum ended the week declining from an extremely over bought condition.
FOREIGN MARKETS
Asian markets were all higher gaining 3.3% on the week.
European markets were also all higher and gained 4.2% on the week.
The Commodity equity group were all higher gaining 2.6% on the week.
The DJ World index gained 3.5% on the week.
COMMODITIES
Bonds continue to uptrend and gained 0.5% on the week.
Crude still looks like it is entering a downtrend but gained 3.0%.
Gold continues to uptrend and gained 1.5%.
The USD is also uptrending and gained 0.2%.
NEXT WEEK
Monday: holiday. Tuesday: Factory orders. Wednesday: ISM services, the FOMC minutes, and FED governor Tarullo gives a speech. Thursday: the ADP and weekly jobless claims. Friday: monthly Payrolls and consumer credit. Best to your weekend and week!
CHARTS: http://stockcharts.com/public/1269446/tenpp
After about 40 years of investing in the markets one learns that the markets are constantly changing, not only in price, but in what drives the markets. In the 1960s, the Nifty Fifty were the leaders of the stock market. In the 1970s, stock selection using Technical Analysis was important, as the market stayed with a trading range for the entire decade. In the 1980s, the market finally broke out of it doldrums, as the DOW broke through 1100 in 1982, and launched the greatest bull market on record.
Sharing is an important aspect of a life. Over 100 people have joined our group, from all walks of life, covering twenty three countries across the globe. It's been the most fun I have ever had in the market. Sharing uncommon knowledge, with investors. In hope of aiding them in finding their financial independence.
Copyright © 2016 Tony Caldaro - All Rights Reserved Disclaimer: The above is a matter of opinion provided for general information purposes only and is not intended as investment advice. Information and analysis above are derived from sources and utilising methods believed to be reliable, but we cannot accept responsibility for any losses you may incur as a result of this analysis. Individuals should consult with their personal financial advisors.
Tony Caldaro Archive |
© 2005-2022 http://www.MarketOracle.co.uk - The Market Oracle is a FREE Daily Financial Markets Analysis & Forecasting online publication.