


Suspicious Reversal in Gold Price
Commodities / Gold and Silver 2016 Aug 23, 2016 - 07:02 PM GMTBy: P_Radomski_CFA

 Gold moved lower early during yesterday's session, but came back up later on and finally gold ended the session only less than $3 lower. Can we view such a reversal as a bullish sign? Not necessarily – a reversal should be confirmed by high volume and yesterday's session wasn't. Consequently, one needs to look at other parts of the precious metals sector for confirmations.
The above action, however, provides bearish signals, not bullish ones. Let's start with the USD Index chart (charts courtesy of http://stockcharts.com).
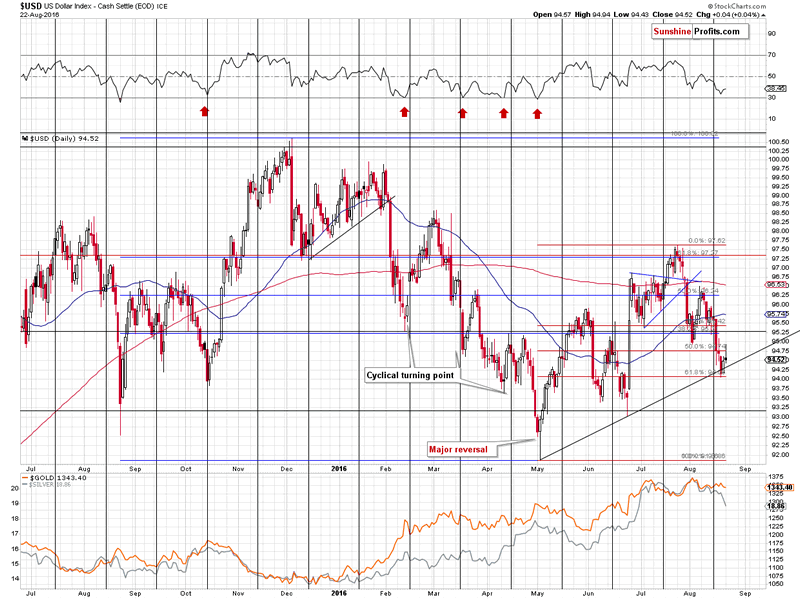
Gold had a very good reason not to decline more – the USD Index moved higher a bit and then gave the gains away. The important thing, however, is that the support line remains intact – consequently, the outlook remains bullish.
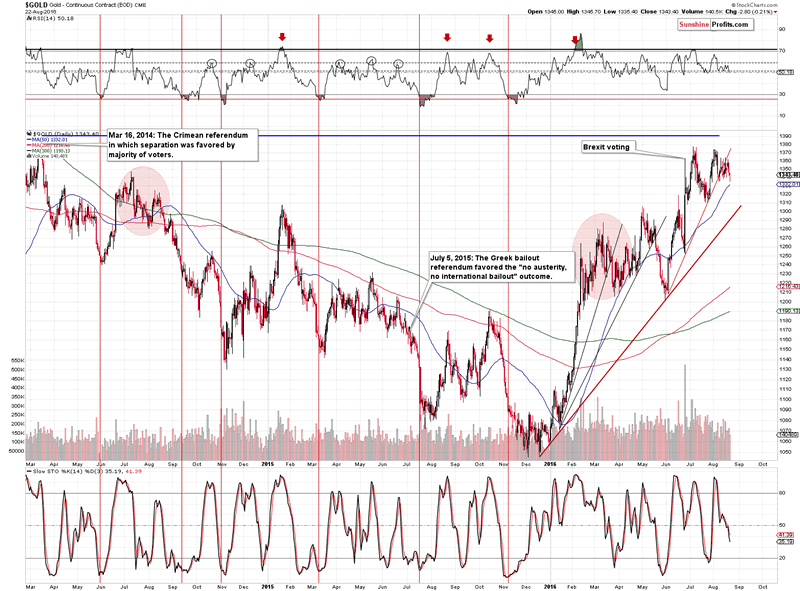
As we wrote earlier, gold reversed, but the volume that accompanied the reversal was relatively small, which suggests that it wasn't really a "reversal", even though the price action may suggest so.
At the first sight it may appear that technical phenomena like reversals, or breakouts etc. are just more or less random names for more or less random price movements without anything that justifies changing the outlook based on any of them. In reality, these are simple terms that refer to phenomena that are indeed happening in the market and that were found to be usually followed by some kind of action. If enough of the reliable factors are seen, the outlook may indeed change.
In case of reversals, the thing that the single candlestick on the chart represents is the situation, in which one side (bulls or bears) attempted to push the price in one direction and got almost or mostly overwhelmed by the other side. If both forces equal each other, the price will not change in terms of daily closing prices (or weekly closing prices, which was more or less the case with gold last week). Now, if the price had been falling previously and we saw this kind of action, it means that the selling pressure was no longer significant enough to trigger further declines and at the same time, the buyers were stronger than previously. The implications would be bullish. Conversely, if the price had been rallying previously and we saw the mentioned kind of action, it means that the buying pressure was no longer significant enough to trigger further upswings and at the same time, the sellers were stronger than previously. The implications would be bearish.
The key thing here is for the above to make sense, there really has to be some kind of "fierce battle" between buyers and sellers. If there was none, we couldn't speak of one side overwhelming the other and thus about bullish or bearish implications. How can we tell, whether one side really overwhelmed the other? By looking at the volume. High volume confirms the above as it suggests that there were high numbers of both buyers and sellers who participated in that session and low volume suggests that there are little implications of this session (in terms of viewing the reversal as important).
With the above in mind, let's take a look at yesterday's volume. It was relatively low. Consequently, it doesn't appear that yesterday was the session when the sellers and buyers were fighting hard to push the price of gold in a given direction with buyers fighting back strongly – significant volume would suggest the above, and instead we saw a move lower and a corrective upswing shortly thereafter. Instead of being bullish, yesterday's session was rather inconsequential by itself.
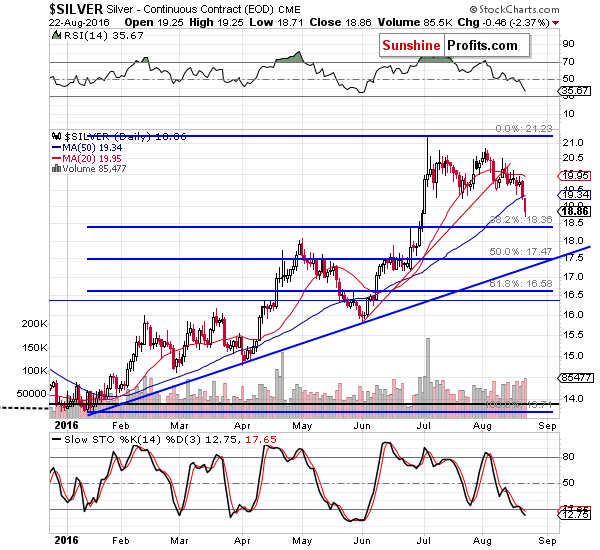
In the case of silver, however, we saw a decline on volume that we hadn't seen in weeks. Consequently, while gold's reversal wasn't confirmed, silver's decline was. The implications are bearish.
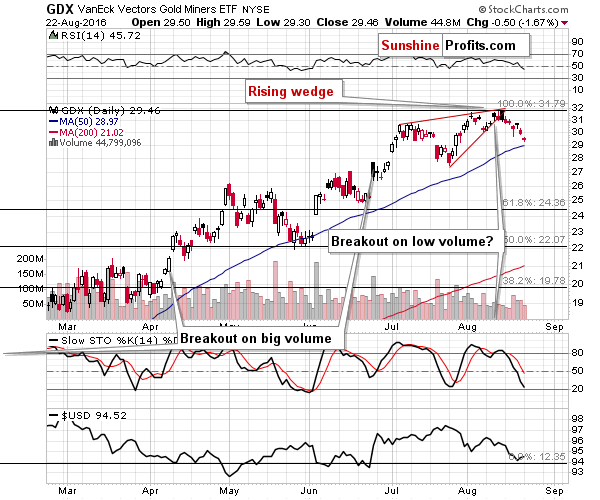
The volume wasn't as huge in the case of mining stocks, but it wasn't very low either and the size of the move is quite visible. Gold stocks continue to underperform gold and this is a sign that lower prices are likely to follow shortly (not necessarily today).
Summing up, the invalidation of the breakdown in the USD Index and the decline on strong volume in silver have bearish implications for the precious metals sector in the short term, while yesterday's reversal in gold doesn't have bullish implications.
There is a 7-day free trial for our Gold & Silver Trading Alerts, which you get automatically after signing up for our free gold newsletter. Again, it's free and if you don't like it, you can always cancel. Sign up today.
Thank you.
Przemyslaw Radomski, CFA
Founder, Editor-in-chief
Tools for Effective Gold & Silver Investments - SunshineProfits.com
Tools für Effektives Gold- und Silber-Investment - SunshineProfits.DE
* * * * *
About Sunshine Profits
Sunshine Profits enables anyone to forecast market changes with a level of accuracy that was once only available to closed-door institutions. It provides free trial access to its best investment tools (including lists of best gold stocks and best silver stocks), proprietary gold & silver indicators, buy & sell signals, weekly newsletter, and more. Seeing is believing.
Disclaimer
All essays, research and information found above represent analyses and opinions of Przemyslaw Radomski, CFA and Sunshine Profits' associates only. As such, it may prove wrong and be a subject to change without notice. Opinions and analyses were based on data available to authors of respective essays at the time of writing. Although the information provided above is based on careful research and sources that are believed to be accurate, Przemyslaw Radomski, CFA and his associates do not guarantee the accuracy or thoroughness of the data or information reported. The opinions published above are neither an offer nor a recommendation to purchase or sell any securities. Mr. Radomski is not a Registered Securities Advisor. By reading Przemyslaw Radomski's, CFA reports you fully agree that he will not be held responsible or liable for any decisions you make regarding any information provided in these reports. Investing, trading and speculation in any financial markets may involve high risk of loss. Przemyslaw Radomski, CFA, Sunshine Profits' employees and affiliates as well as members of their families may have a short or long position in any securities, including those mentioned in any of the reports or essays, and may make additional purchases and/or sales of those securities without notice.
Przemyslaw Radomski Archive |
© 2005-2022 http://www.MarketOracle.co.uk - The Market Oracle is a FREE Daily Financial Markets Analysis & Forecasting online publication.