


Stock Market Long View
Stock-Markets / Stock Markets 2016 Aug 30, 2016 - 11:56 AM GMT

 You may have noticed that I have used two different Orthodox Broadening top trendlines. Both work, but for different reasons. The top one shows maximum resistance where the SPX has not been able to overcome it, while the lower one shows support, which has been broken in the past and appears to be challenged again today.
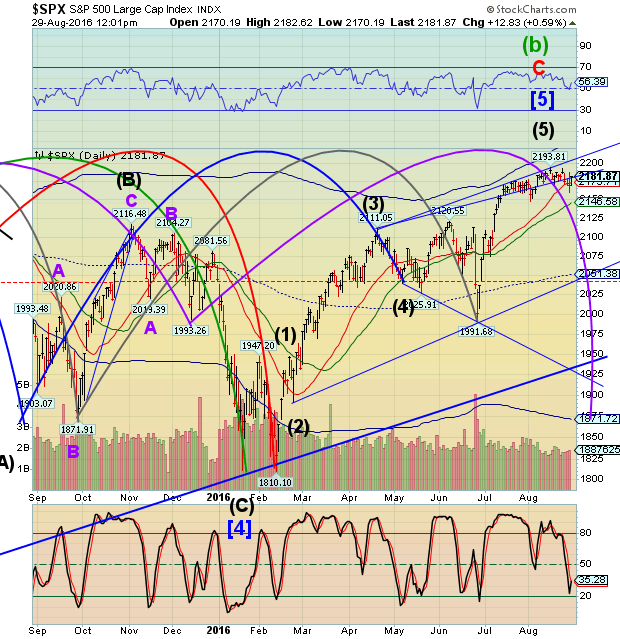
Intermediate-term support is at 2173.71, which may be broken imminently.
I am showing you both the daily and weekly SPX charts to show the longer Cycles, which you shall see shortly.
Sorry that I cannot show a larger chart of the weekly SPX, but only so much data can be put into an email.
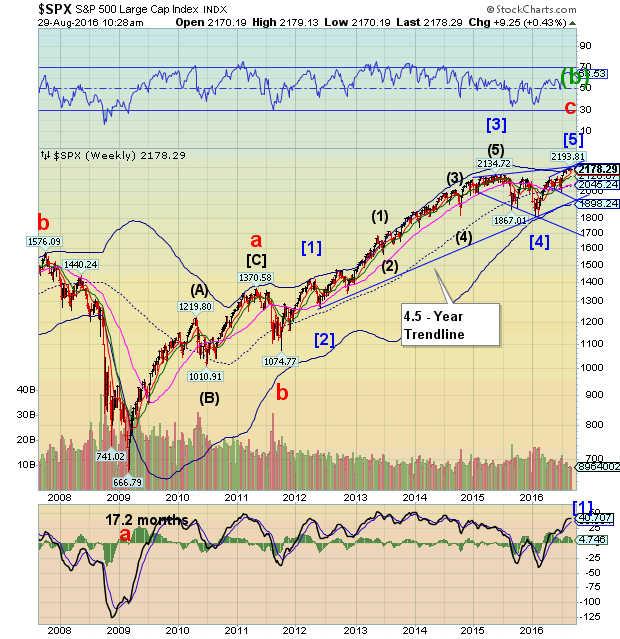
The first data point that I want to discuss is the October 11, 2007 high at 1576.09. (2007.778). Should we add 8.6 years to that, we arrive at 2016.378, which is May 17, 2016. That Cycle inverted, so we ended up with a low on May 19, 2016, only two days later (visible on the daily chart).
The next data point is November 26, 2007 (2007.904), the first low off the October 2007 high. Add 8.6 to that and we get 2016.504, which is July 2, 2016. The Brexit low was on June 27, 2016, only 4.3 days earlier.
The third data point is January 23, 2008 (2008.063). Add 8.6 years and the result is 2116.663 (today). I want to point out that the January 23 ,2008 low was only 58 days after the November 26, 2007 low, so there is some wiggle room in our calculations. If we allow up to 4.3 days from today, we may get the Master Cycle low as late as Friday. However, if we compute 12.9 days from the high on August 15, we have a potential bottom at the close on Wednesday, August 31. So far, this is speculation and we could see the low occur later, depending on the circumstances.
Another point to consider is that the decline from the October 11, 2007 high to the January 23, 2008 low was 19.4%. Should that percentage loss repeat, the target may be as low as 1768.00. The current target is 1871.75, the daily Cycle Bottom support. A panic may add another 100 points to that expectation.
The final data point is the Wave 5 low on March 17, 2008 (2008.208). 8.6 years later puts the final low of this decline at 2016.808 (October 22, 2016). My Cycles Model has a Pi date on Monday, October 24. If this analysis is correct, we may see a low at the end of October near 1000.00! This may be very disruptive, both politically and economically, so prepare yourself.
Now let us take a look at the USD. The three decade low in USD was March 17, 2008 (2008.208). 8.6 years later is October 22, 2016, while day 258 of the Master Cycle may be as late as October 26.
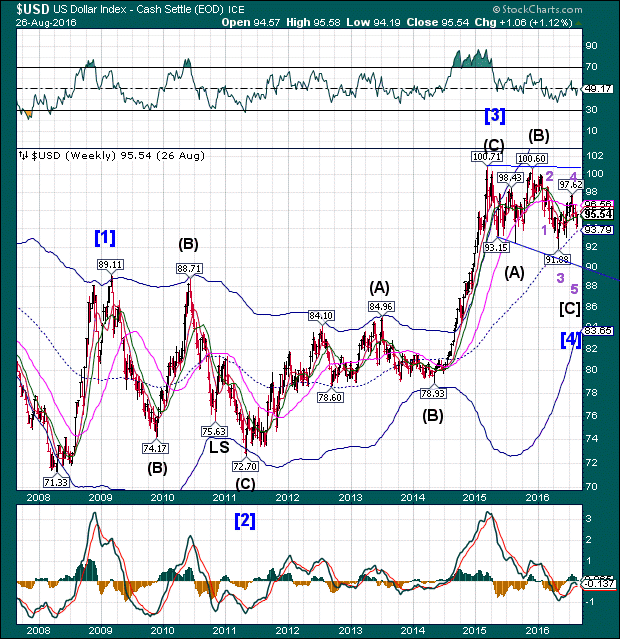
USD is just completing a Wave [b]. Wave [c] starts today. This may lead to a major liquidity crisis, so be prepared.
Regards,
Tony
Our Investment Advisor Registration is on the Web.
We are in the process of updating our website at www.thepracticalinvestor.com to have more information on our services. Log on and click on Advisor Registration to get more details.
If you are a client or wish to become one, please make an appointment to discuss our investment strategies by calling Connie or Tony at (517) 699-1554, ext 10 or 11. Or e-mail us at tpi@thepracticalinvestor.com .
Anthony M. Cherniawski, President and CIO http://www.thepracticalinvestor.com
As a State Registered Investment Advisor, The Practical Investor (TPI) manages private client investment portfolios using a proprietary investment strategy created by Chief Investment Officer Tony Cherniawski. Throughout 2000-01, when many investors felt the pain of double digit market losses, TPI successfully navigated the choppy investment waters, creating a profit for our private investment clients. With a focus on preserving assets and capitalizing on opportunities, TPI clients benefited greatly from the TPI strategies, allowing them to stay on track with their life goals.
Disclaimer: The content in this article is written for educational and informational purposes only. There is no offer or recommendation to buy or sell any security and no information contained here should be interpreted or construed as investment advice. Do you own due diligence as the information in this article is the opinion of Anthony M. Cherniawski and subject to change without notice.
Anthony M. Cherniawski Archive |
© 2005-2022 http://www.MarketOracle.co.uk - The Market Oracle is a FREE Daily Financial Markets Analysis & Forecasting online publication.