


Crude Oil Price Trend Forecast 2016 Update
Commodities / Crude Oil Sep 14, 2016 - 01:47 PM GMTBy: Nadeem_Walayat

 At the start of the year the prevailing mood in the oil market was not just one of doom and gloom but of catastrophe as the oil price sunk below $30, skidding by the middle of February to virtually touch $25, a period during which many prominent analysts and investment banks such as Goldman Sachs all of whom were bearish on the prospects for oil price this year even suggesting that the oil price could sink to as low as $10 (Standard Chartered) which meant that the oil producers, the frackers and even a string of nations such as Russia, Nigeria and Venezuela were on the fast track towards going bust in as their oil profits that financed state spending budget deficits evaporated.
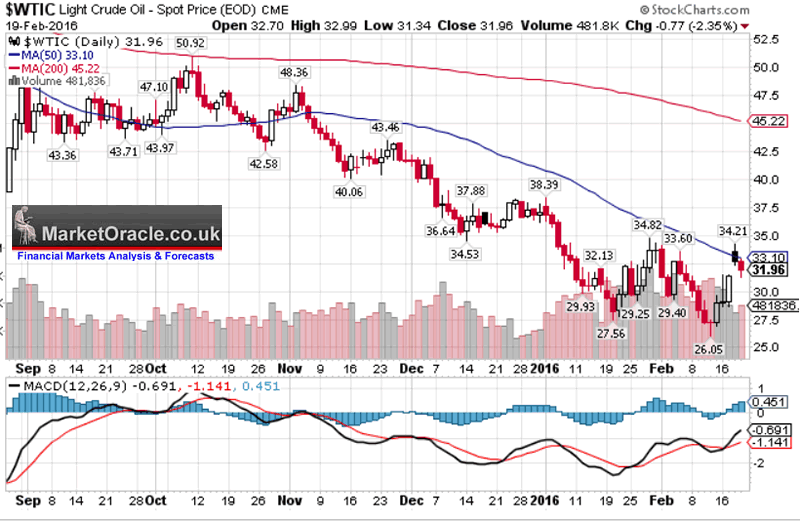
We'll now 7 months on and the oil market has gradually transformed itself from that of an imminent $10 apocalypse to one of hopeful recovery as the oil price has clawed it's way back relentlessly through a series of critical levels of first $30, $35, $40, and popping above $50 to a high of near $52 for the year! More than DOUBLING from its 2016 low! At which point all those who failed to see the rally coming began forecasting higher prices i.e. one of the biggest oil bears of the year, Goldman Sachs reckoned that the oil supply glut has evaporated and oil prices are going to reach $51, at about the time when crude oil was virtually hitting their supposed forecast.
These are the SAME who have been banging the drums all year for sub $20 oil price, but then AFTER the oil price DOUBLED were proclaiming themselves as being bullish! This illustrates an important point! Goldman Sachs and the REST are nothing more than salesmen! They clearly don't rely on their forecasts when trading as you or I understand trading to be, for if they did they would be back to being just as bankrupt as they were during the financial crisis.
Crude Oil Price Trend Forecast 2016
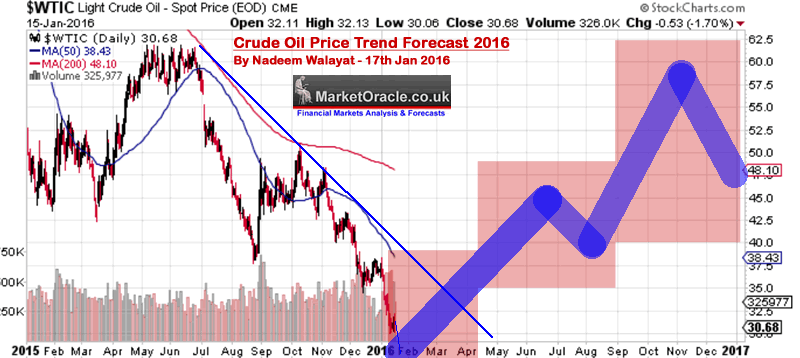
In terms of my oil price forecast for 2016, my in-depth analysis of Mid January forecast expectations for the crude oil price to bottom by early February at approx $25, the actual bottom came in at $26 and within the time window for a final bear market bottom as the following video analysis and article excerpt illustrate:

17 Jan 2016 - Crude Oil Price Crash Triggering Global Instability, Trend Forecast 2016
Crude Oil Price 2016 Forecast Conclusion
My forecast conclusion is for the crude oil price to trade within three distinct trading ranges for 2016 of $20 to $40, $35 to $50 and $62 to $40. Furthermore the trend pattern imposed onto the trading ranges implies that a bottom is likely by early February 2016 at around $25, followed by a trend higher into Mid year towards $50, a correction into September, followed by a trend towards $62 before succumbing to a correction during December to target an end year price of approx $48 as illustrated by the following forecast graph.
Crude Oil Price Forecast 2016 - Current State
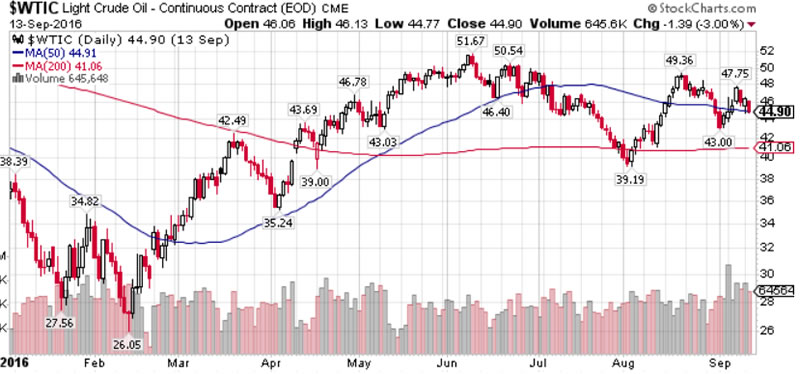
The crude oil price rallied from the mid February low of $26, trending higher all the towards setting a high for 2016 at $52 early June before succumbing to its most recent correction to $39. This is set against my crude oil price trend forecast of Mid January 2016 that forecast crude oil prices by Mid September should be at about $45 after correcting to an August low of $39.
Whilst my last oil update of Mid May 2016 confirmed expectations for the oil price to correct during the Summer from the the then high price of $48 which subsequently come to pass. Therefore crude oil continues to show little deviation from the forecast trend which is now into its 9th month. Which thus implies that the oil price rally should soon resume by targeting a trend to a high of $60 during November before correcting during December.
And just as I stated in Mid May the oil price correction has definitely once more brought out the doom merchants who for instance proclaim that the oil price rally as being nothing more than a short covering rally.
Crude Oil Analysis
Fundamentals - The major oil producers have failed to agree an output cut or freeze which is oil price negative. Whilst the oil industry continues to cut back on exploration which is long-term positive for oil prices. The IEA reported that the oil glut is expected to continue well into 2017 as well as downgraded demand growth. So on balance theres not been as much supply destruction as there should have been which implies a weaker oil price trend.
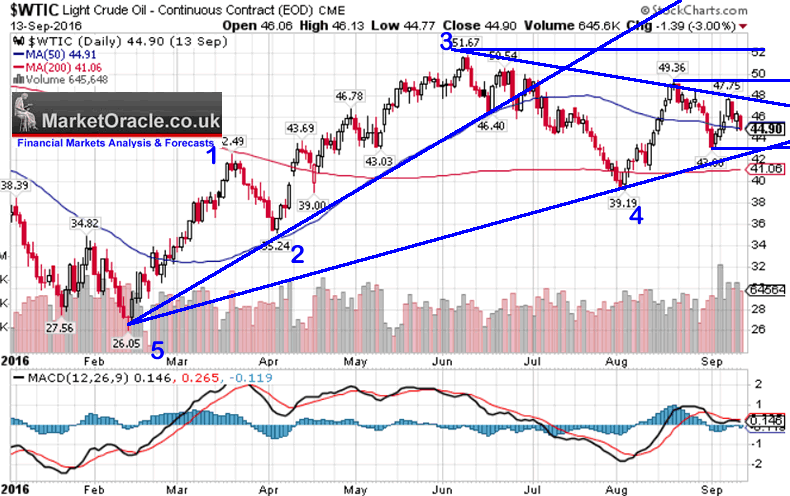
Trend Analysis - The oil price is in a narrowing range pending a breakout. A downside break would be below $42 and to the upside about $48, as the over-riding trend is up then the breakout should be to the upside. A resolution should be within the next week or so. With confirmation on break above $49.50. Whilst to the downside next support would be at $39.
MACD - Is fairly neutral which implies the resulting trend could persist for several months.
Elliott Wave - The simplest pattern resolves to the $39 low being a Wave 4 low which implies we should now be in the early stages of an impulse Wave 5 that will be somewhere between Wave 3 and Wave 5 in expectations or $14 to $18 which would extend to about $53-$57.
Seasonal Analysis - OIl prices tend to rise during September then fall into December followed by a late December rally. So the opposite of my trend forecast.
US Dollar
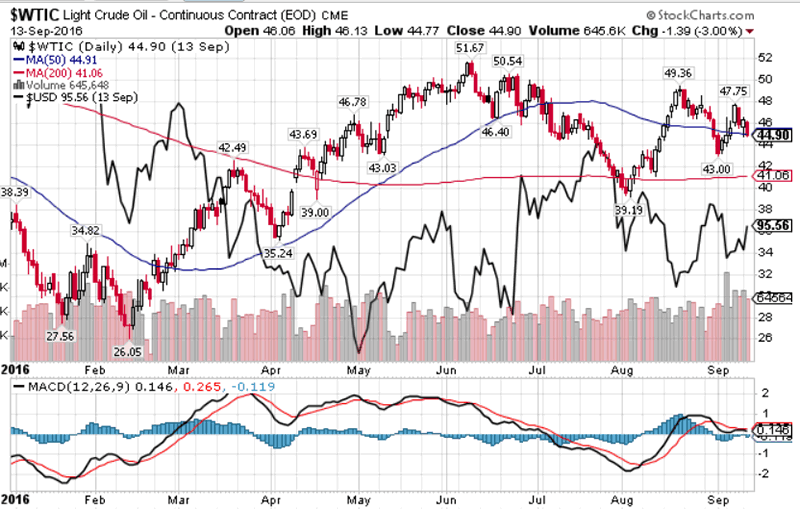
Overall the oil price continues to exhibit in an inverse relationship to the US Dollar which means not to expect any significant spike in the oil price anytime soon. The USD continues to trade within a relatively tight range of $94 to $100. However immediate trend is upwards which implies immediate oil price weakness. Therefore clearly for the oil price trend to resume then USD needs to fail to break higher beyond immediate resistance at $96, else it's going to be tough to get the oil price rally going.
Conclusion
The overall picture being painted is one of future oil price weakness relative to my trend forecast. With the potential for the oil price to break lower and waste time around $40 before rallying. So whilst there has been no significant deviation to date, going forward the oil price will likely find it tougher going over the next couple of months than I originally concluded it would back in January.
Therefore I expect the oil price to now target a slightly lower high for 2016 of $55 against my January forecast high of $60.
My next in-depth analysis will seek to map out a trend forecast for the stock market for the remainder of 2016, so ensure you are subscribed to my always free newsletter to get this in your email in box.
By Nadeem Walayat
Copyright © 2005-2016 Marketoracle.co.uk (Market Oracle Ltd). All rights reserved.
Nadeem Walayat has over 25 years experience of trading derivatives, portfolio management and analysing the financial markets, including one of few who both anticipated and Beat the 1987 Crash. Nadeem's forward looking analysis focuses on UK inflation, economy, interest rates and housing market. He is the author of five ebook's in the The Inflation Mega-Trend and Stocks Stealth Bull Market series that can be downloaded for Free.


 Nadeem is the Editor of The Market Oracle, a FREE Daily Financial Markets Analysis & Forecasting online publication that presents in-depth analysis from over 1000 experienced analysts on a range of views of the probable direction of the financial markets, thus enabling our readers to arrive at an informed opinion on future market direction. http://www.marketoracle.co.uk
Disclaimer: The above is a matter of opinion provided for general information purposes only and is not intended as investment advice. Information and analysis above are derived from sources and utilising methods believed to be reliable, but we cannot accept responsibility for any trading losses you may incur as a result of this analysis. Individuals should consult with their personal financial advisors before engaging in any trading activities.
Nadeem Walayat Archive |
© 2005-2022 http://www.MarketOracle.co.uk - The Market Oracle is a FREE Daily Financial Markets Analysis & Forecasting online publication.