


Stocks, Bonds, Gold and Commodites - It’s January 2013, With a Twist
Stock-Markets / Financial Markets 2016 Oct 01, 2016 - 01:43 PM GMTBy: Gary_Tanashian

 The title was not meant as a play on words in reference to Operation Twist, but now that I think about it, maybe it should be. The Post-Twist financial world is far different than it was before the genius that is Ben Bernanke’s ‘bigger than yours or mine’ brain concocted a maniacal plan that would “sanitize inflation” signals from the bond market and break the then highly elevated yield curve.*
So, why is today like early 2013 and why is there a twist to that view? Because two indicators have come together to point to economic stability (at least) in the US, with the twist being that other indicators are pointing to a potential unchaining of inflation this time, unlike the 2013 time frame, which was in the grips of global deflation (and Goldilocks in the US).
So gold bugs, don’t get too concerned just yet. The sector has been overdue for a correction and that is what it has been getting. Speaking of sanitizing things, over bullish gold sector sentiment has needed a good clean out. The 2013 signal immediately preceded the worst of the precious metals bear market, but the 2016 signal need not for reasons explained later in the article.
However, gung ho bugs should have a plan to moderate or alter their views on gold stocks because they are likely to be nothing special, fundamentally, in what unfolds going forward. In other words, you should tune out gold obsessives who want you to be enthralled with this sector above all others (or modify the types of precious metals stocks you invest in, which we often discuss in NFTRH).
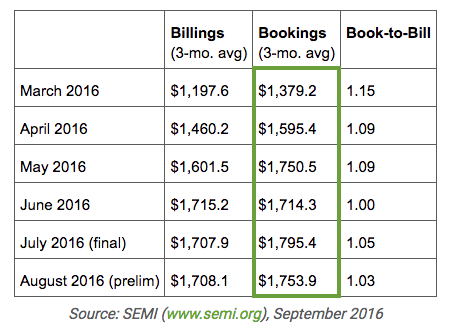
As for the similarities to 2013, how about the Semiconductor sector, which we called a Canary in the Coal Mine in January 2013 and have been doing once again since the spring of 2016. Here is only the latest view of the Semi Equipment bookings trend that formed early in the year and has been rock solid since.
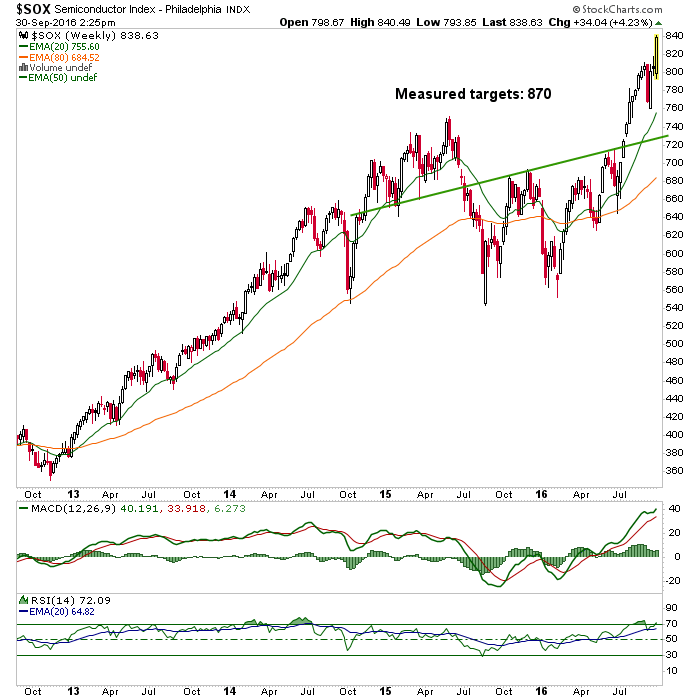
Here is the Semiconductor index, steaming toward the target. It’s over bought but seemingly just does not care. Our contrarian call of the spring is now entering momentum-driven manic territory. And this is only the conservative, shorter-term target. Monthly charts indicate an ultimate target well up in the 900’s. Folks, I don’t make them, I only interpret them.
One more Semi related chart and we’ll move on. If you think big tech leads the stock market (on this cycle it does) then who leads big tech? Eh Beuller? For the entirety of 2016 the Semis have led and this week there was another big surge. Until this is broken, we do not have any sort of bearish signal on the market.
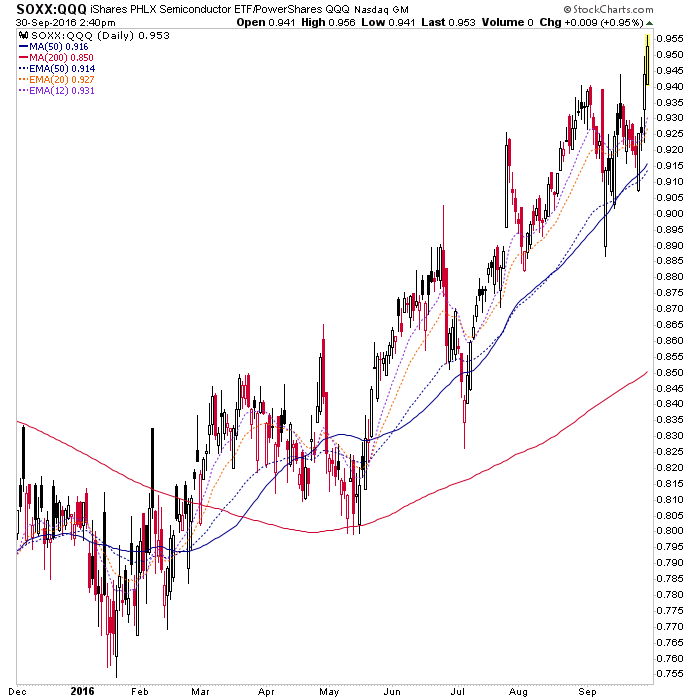
Several components of the US market are still technically vulnerable to a resumed correction, but the Semis made a new cycle high today and the Transports, which many have claimed are a negative divergence to the Dow and so a bearish signal, are sporting a bullish chart. While a market correction can resume, we are now on the lookout for bull mania as well. All major trends after all, are and have been up.
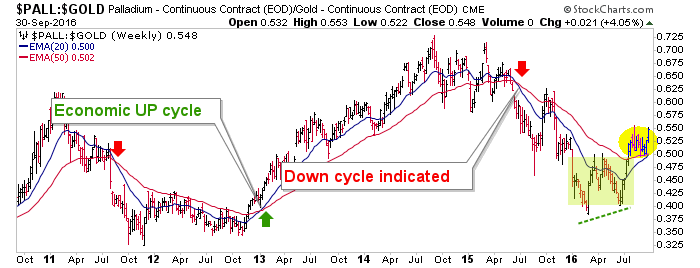
Now for the 2013 cross-reference indicator, the Palladium to Gold Ratio. No indicator is a be-all, end-all, especially in the Post-Twist age of systemic dysfunction. But when talking probabilities Pall-Gold worked like a charm to all but confirm the Semi up ramp in 2013. Here is Pall-Gold on the very verge of another positive macro economic signal in support of the Semi data to date.
So why is 2016 different than 2013, despite the two bullish signals echoing 2013? Because back then silver still had a long way to go in its coming under performance to gold and inflation expectations and yield curves still had a long way to drop. What was bullish back then is bullish now, but the difference is that what was bearish back then (precious metals, commodities and certain global markets) is not now because inflation appears to be on tap.
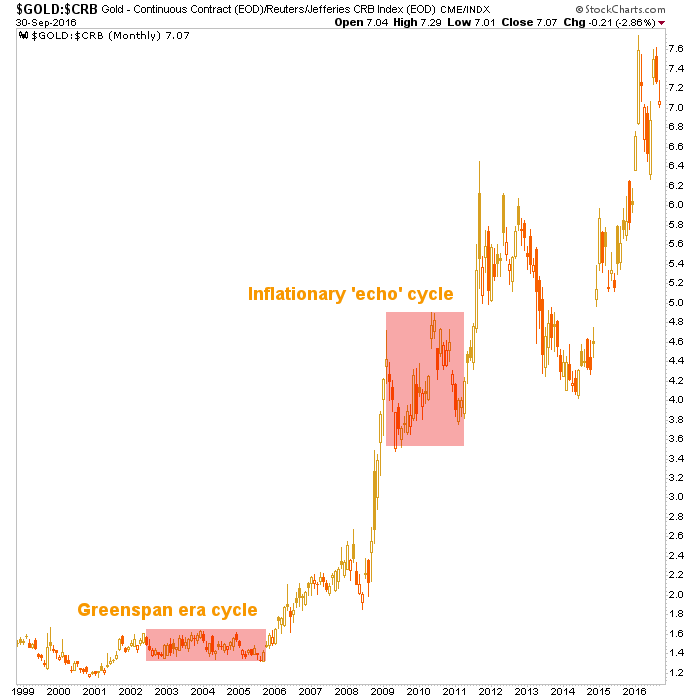
Below is the weekly chart of Gold vs. various Commodities that once had a single lonely breakdown (Gold-Silver), was promptly joined by another (Gold-Palladium) and now sees Crude Oil and Industrial Metals getting out of the barn vs. Gold as well. The blueprint is the Greenspan era, circa 2003-2007. During that cycle commodity gurus made their bones pumping the masses to buy “the metals” (as if copper and tin are even in the same zip code as gold), about buying oil, about buying resources of all kinds to protect yourself from the great inflation. Well, in a year or so we may well be receiving sermons from a new batch of gurus (along with survivors from the last promotion). But I digress.
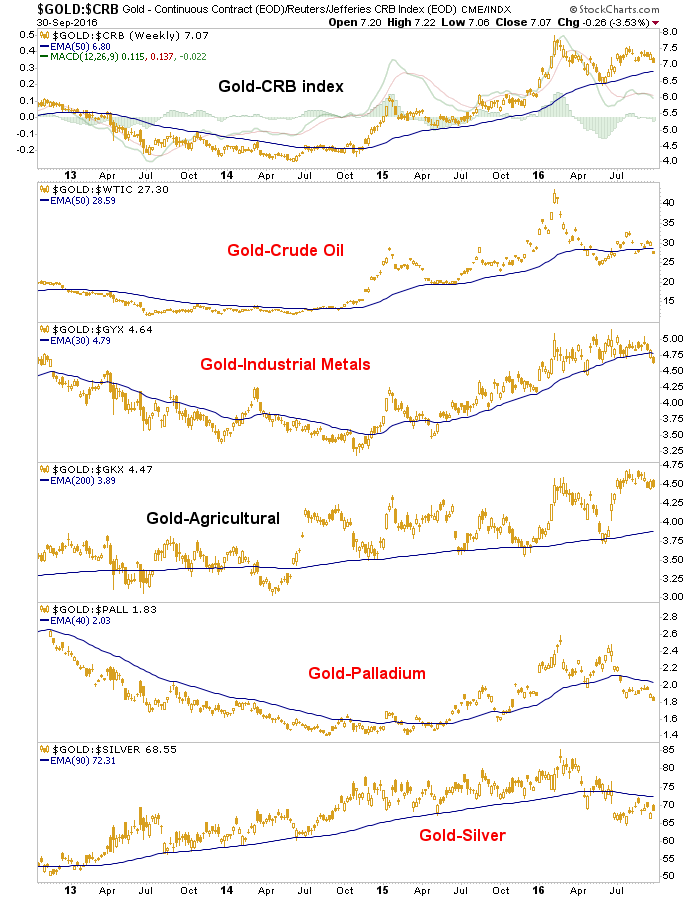
Gold tends to flat line vs. Commodities in an inflationary phase. For the majority of the Greenspan era cycle Gold-CRB went sideways. During the secondary cycle that blew out in 2011 Au-CRB went sideways again, with a whole lot of volatility during the process.
Gold is now broken down vs. two commodities that are also precious metals (Silver and Palladium). It makes sense that these would have been the most sensitive and thus, early. But Industrial Metals? If this proceeds to a confirmed breakdown you’d probably not want to be short much of anything in the asset markets, except for long-term Treasury bonds.
Speaking of which, as bonds decline yields rise and that leads us right to our most venerable, though lumbering, indicator; the 30 year Treasury bond yield (AKA the Continuum) and its storied history of limiting expressions of greed, optimism and inflation right at the 100 month EMA.
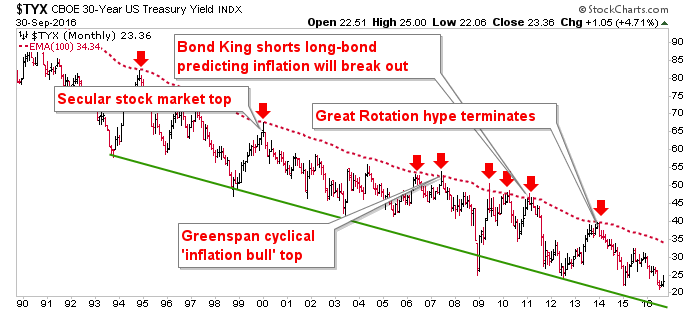
So in the event that we do go full frontal manic up with an inflationary twist, if you do not sell and take your profits when the 30 year yield hits the red dotted line (limiter) I am going to be very disappointed in you. Seriously, the table is being set for something. It will be high risk because it goes hand in hand with policy makers’ desperation and will to inflate. These are not your Grandpa’s markets. There will be a ‘Musical Chairs’ aspect to it at some point. But in a time when investors are compelled to eschew risk avoidance in favor of risk taking, that’s par for the course.
We did not even need a tin foil hat to see what Janet Yellen has up her sleeve in order to try to functionally help the inflation along should it show signs of failing. We’ll simply note the two indicators above that are flashing “bullish” for the economy and potentially, stocks. But also the indicators that say this time there would likely be an inflationary component to it.
* As often belabored, the act of selling short-term Treasury bonds while buying long-term Treasury bonds worked against the yield curve and its inflationary message of the time. Twist literally bent the curve to the will of policy makers and a once orderly system has been in so many ways dysfunctional ever since.
Subscribe to NFTRH Premium for your 25-35 page weekly report, interim updates (including Key ETF charts) and NFTRH+ chart and trade ideas or the free eLetter for an introduction to our work. Or simply keep up to date with plenty of public content at NFTRH.com and Biiwii.com.
By Gary Tanashian
© 2016 Copyright Gary Tanashian - All Rights Reserved
Disclaimer: The above is a matter of opinion provided for general information purposes only and is not intended as investment advice. Information and analysis above are derived from sources and utilising methods believed to be reliable, but we cannot accept responsibility for any losses you may incur as a result of this analysis. Individuals should consult with their personal financial advisors.
Gary Tanashian Archive |
© 2005-2022 http://www.MarketOracle.co.uk - The Market Oracle is a FREE Daily Financial Markets Analysis & Forecasting online publication.