


Santa Trump US Stock Market Uptrend Continues
Stock-Markets / Stock Markets 2016 Nov 20, 2016 - 04:10 AM GMTBy: Tony_Caldaro

 The market started the week at SPX 2164. After a bounce to SPX 2171 on Monday the market pulled back to 2156. On Tuesday the SPX hit 2181, but this was followed by a pullback to 2171 on Wednesday. On Thursday/Friday the SPX made a new uptrend high at 2190, then dipped to end the week at 2182. For the week the SPX/DOW gained 0.45%, and the NDX/NAZ gained 1.40%. Economic reports for the week were mostly positive. On the downtick: import prices, capacity utilization and the WLEI. On the uptick: retail sales, export prices, NY/Philly FED, business inventories, the CPI, housing starts, building permits, the Q4 GDP estimate, plus weekly jobless claims improved. Next week will be highlighted by the FOMC minutes, more housing reports and the Thanksgiving holiday.
LONG TERM: uptrend
Some observations. Since the election the DOW, NAZ, R2K, SOX and TRAN have all made new yearly highs. The DOW and R2K highs were also all time highs. The NDX, NYSE and the SPX have been the laggards. While the NDX and SPX made all time new highs earlier in the year, the NYSE has still not made a higher high than 2015. Neither has any foreign index that we track with the exception of the FTSE. The NYSE continues to act more like an international index, than a US index.
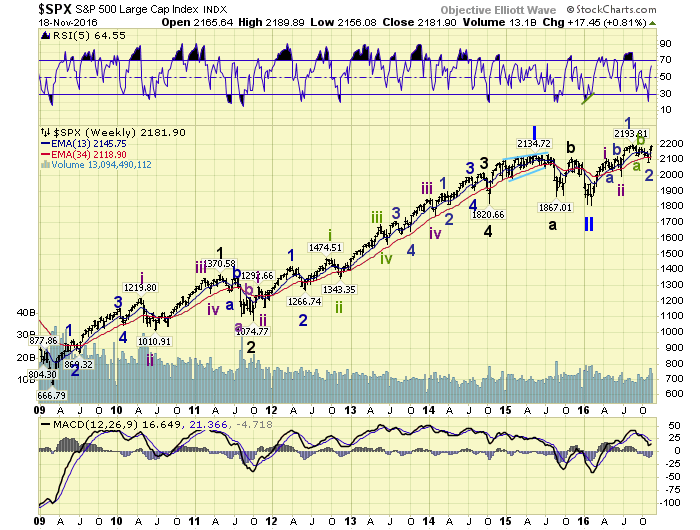
After a long term downtrend low in February 2016, the first since March 2009, the market embarked on a long term uptrend. Since 2011 did not quantify as a long term trend change, and the May 2015 – February 2016 decline was only 16%, we have labeled the long term trends as follows. Primary I May 2015, Primary II February 2016, and Primary III underway. From the February low the SPX has rallied to 2111, did a three wave decline to 1992, rallied to 2194, done another three wave decline to 2084, and is now rallying in a new uptrend.
MEDIUM TERM: uptrend
We labeled the SPX 2111 high Intermediate wave i, and the 1992 low Intermediate wave ii. Then the SPX 2194 high Minor wave 1 of Int. iii, and the 2084 low Minor wave 2. The current uptrend should be Minor wave 3 of Intermediate wave iii. Since Primary waves unfold in five Major waves, you can see we are in the very early stages of Primary III. In fact, only in the subdivisions of Major wave 1.
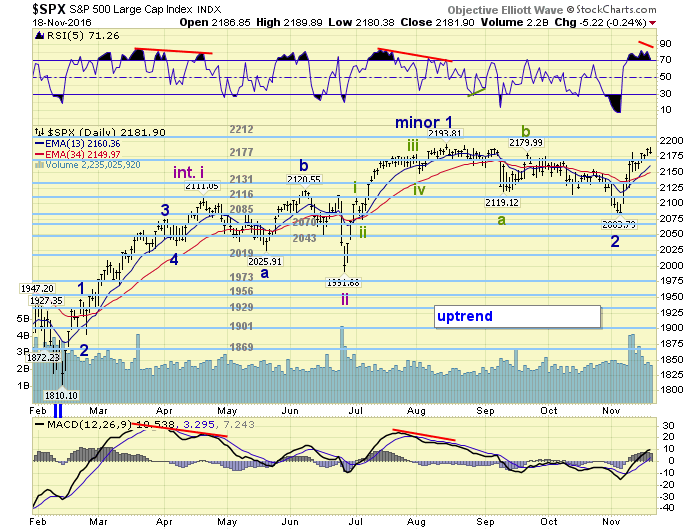
At the Minor wave 2 low of SPX 2084 the market displayed the usual characteristics of a downtrend low. The daily/weekly RSI were quite oversold, and the hourly RSI had a positive divergence. Since that low the market has rallied 106 points, 5.1%, in just two weeks. And a few of the earlier mentioned indices have done even better: TRAN +9%, SOX +9% and R2K +13%. The recent action certainly looks like the kick off to a third degree wave.
As each new bull market unfolds, and we believe this is a new bull market, it develops its own characteristics. Thus far this bull market has displayed two month uptrends followed by multi-month corrections. As noted last weekend it looks similar to the 1984 period. Since this uptrend began this month we should expect it to last until at least January. Santa rally underway! Also the first two uptrends were 300 and 200 points respectively. This suggests this uptrend should be about 300 points, and reach the SPX 2380’s before it concludes. Medium term support is at the 2177 and 2131 pivots, with resistance at the 2212 and 2270 pivots.
SHORT TERM
Early this week we noticed another short term count unfolding, and it has worked out quite well thus far. From the SPX 2084 downtrend low we counted four waves up: 2147-2125-2182-2152, with a fifth wave underway. The fifth wave was counted as follows: 2171-2156-2181-2172-2190. This entire advance, SPX 2084-2190, is only Minute wave i of Minor wave 3. There will be five Minute waves during this Minor 3 uptrend.
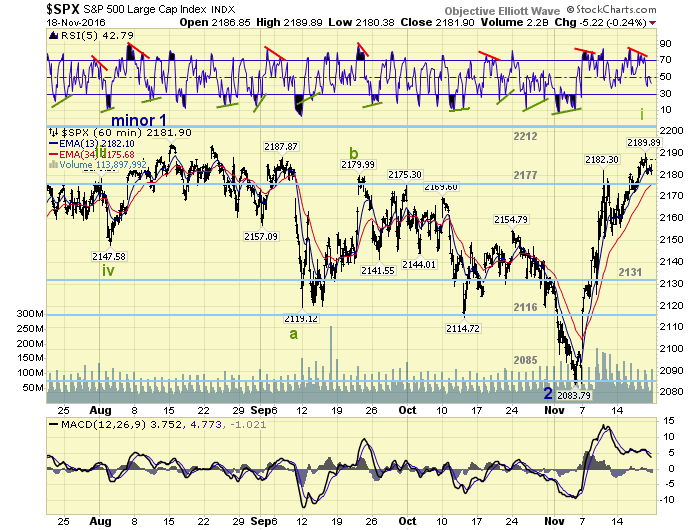
Approaching the high, we noted on Thursday, there were negative divergences on the hourly/daily RSI. This typically occurs during a top of some degree. We also noted, due to the configuration of the waves, there was three resistance levels overhead: SPX 2194, SPX 2200 and SPX 2209. Two levels and then the 2212 pivot range. When the rally does end the pullback could take the SPX back to the 2150’s for Minute wave ii. After that Minute iii should kick in to the upside. Short term support is at the 2177 pivot and SPX 2151, with resistance at SPX 2194, SPX 2200 and the 2212 pivot. Short term momentum ended the week under neutral.
FOREIGN MARKETS
Asian markets were mostly lower but ended the week mixed.
European markets were mixed and ended with a 0.3% loss.
The DJ World index ended the week -0.2%.
COMMODITIES
Bonds continue their downtrend and lost 1.2%.
Crude appears to be uptrending again and gained 6.8%.
Gold continues its downtrend and lost 1.3%.
The USD reached 13 year highs while gaining 2.4% on the week.
NEXT WEEK
Tuesday: existing home sales. Wednesday: weekly jobless claims, durable goods, the FHFA, consumer sentiment, new home sales and the FOMC minutes. Thursday: Thanksgiving holiday. Friday: markets open but closing at 1pm. Happy holidays!
CHARTS: http://stockcharts.com/public/1269446/tenpp
After about 40 years of investing in the markets one learns that the markets are constantly changing, not only in price, but in what drives the markets. In the 1960s, the Nifty Fifty were the leaders of the stock market. In the 1970s, stock selection using Technical Analysis was important, as the market stayed with a trading range for the entire decade. In the 1980s, the market finally broke out of it doldrums, as the DOW broke through 1100 in 1982, and launched the greatest bull market on record.
Sharing is an important aspect of a life. Over 100 people have joined our group, from all walks of life, covering twenty three countries across the globe. It's been the most fun I have ever had in the market. Sharing uncommon knowledge, with investors. In hope of aiding them in finding their financial independence.
Copyright © 2016 Tony Caldaro - All Rights Reserved Disclaimer: The above is a matter of opinion provided for general information purposes only and is not intended as investment advice. Information and analysis above are derived from sources and utilising methods believed to be reliable, but we cannot accept responsibility for any losses you may incur as a result of this analysis. Individuals should consult with their personal financial advisors.
Tony Caldaro Archive |
© 2005-2022 http://www.MarketOracle.co.uk - The Market Oracle is a FREE Daily Financial Markets Analysis & Forecasting online publication.