


The Birth Pains of a New Stocks Bull Market
Stock-Markets / US Stock Markets Aug 05, 2008 - 03:07 PM GMTBy: Clif_Droke

 After what has seemed to many investors to be the “longest year”, stocks have been going through a volatile period which some interpret to be bearish. There are still many analysts who are quick to label the current market phase a temporary pause on the way to a bigger stock market cascade. Contrary to these expectations, the market tape is sending a different message as we'll establish in this commentary.
It has been all too easy to dismiss the recent state of affairs in the financial markets as the start of a major bear market and economic depression. The pain that has been inflicted has left deep and abiding wounds that won't soon be forgotten by most investors. Making matters worse, every time a negative news event crosses the wires it adds to the widespread belief that the U.S., and indeed the emerging foreign powers, teeters on the brink of a major financial catastrophe.
All too many observers have been quick to dismiss the currently negative environment as the beginning of a major long-term bear market. The pain that is being experienced in the financial markets, however, is akin to the birthing pains of a new cyclical bull market and one that will soon be under way. The leading indicators are affirming this message loud and clear and we'll take a look at some of those indicators right now.
Back in January I wrote that the 6-year Kress Cycle would bottom later this summer. The 6-year cycle has obviously been the dominant feature of this market since the start of the year. In a previous commentary we saw that the 6-year cycle tends to exert a two-fold influence: it pushes stock prices lower during the cycle's final “hard down” phase while creating an upward bias on fuel prices. That has certainty proven to be the case this year. There are preliminary signs that this relationship is reversing since July as the cycle bottom nears. Indeed, the crude oil price has fallen sharply since last month while the stock market has shown signs of deceleration in its internal rate of change. This in turn will lead to a reversal in stock prices.
Before any great advance in stock prices can begin there must be a lifting of cyclical pressures. In the present case the downward pressure on stock prices has been a consequence of the 6-year cycle bottoming. Conversely, the 6-year cycle created an uptrend in fuel prices. The dramatic increase in fuel prices this year has had an obvious depressing effect on both the stock market as well as on consumer sentiment.
Surging food and fuel prices, along with a near constant stream of extraordinarily bad news, had a major impact on investor psychology as well. The average retail investor went into the proverbial bomb shelter months ago in reaction to this negativity. Investors en masse fled stocks and ran to the perceived safety of bonds and money market funds. This “flight to quality” was unlike anything witnessed in recent years, especially given its duration. Most bear markets end this way but this year's market decline began and is ending in this manner.
After taking a profound beating, investor sentiment has now fallen to a sufficient level of pessimism to justify a bottom in the stock market even before the 6-year cycle formally bottoms. It certainly wouldn't be unprecedented if the market put in a major price low ahead of the time cycle low. The same thing happened in 2004 in the NASDAQ when the 10-year cycle was bottoming. The NASDAQ bottomed in early August 2004 while the 10-year cycle bottom was for several weeks later. It happened again when the Dow made its final correction low in June-July 2006 ahead of the 4-year cycle bottom scheduled for that year. Indeed, it has become a fairly common occurrence for market bottoms to precede the major yearly time cycle lows whenever investor sentiment has been driven to extremely negative levels as it has this summer.
Another sign that the market decline is in the process of reversing with a new bull market soon to be underway is seen in the traditionally “smart money” options indicators. I'm referring to the OEX put/call open interest ratio, which has been quite accurate in calling the major tops and bottoms for the S&P 100 in recent years. The message of that ratio is currently bullish.
Here's what the “smart money” options traders have been doing in the OEX options since June. While the public was panicking, the cool-headed pros were getting into a net long position in the S&P 100 options. This indicator has been one of the most reliable ones for pegging interim tops and bottoms, and while it can't be used to pinpoint turning points in the very short term, it has proven exceptionally useful for heralding the interim up and down moves in the broad market. This time appears to be no exception as the net long position among smart money options traders is pointing to a reversal of this year's market woes.
Ever since the credit crisis started in 2007, certain analysts have advanced the oft-repeated argument that the Fed has “flooded the financial system with liquidity.” They further argue that this liquidity has contributed in no small part to the rise in food and fuel prices this year and that more inflation is on the way. Nothing could be further from the truth.
To be precise, inflation is defined as an increase in money supply relative to the amount of goods available in an economy. Classical inflation is a case of “too much money chasing too few goods” with the chase spreading to every sector of the economy.
Inflation is characterized domestically by rising interest rates and rising wage levels, neither of which are factors in the U.S. economy. True inflation is something the U.S. dealt with in the 1960s and ‘70s. This was during the time when the U.S. was the world's industrial superpower and workers were able to demand wage increases to keep pace with the rising cost of living. The K-wave (economic long wave) was in its inflationary phase and the Baby Boomers were in their most productive years. The demographic status of the U.S. was at that time very much favorable for an inflationary environment and the inflationary fires were burning into the late ‘70s.
Today, monetary inflation is a problem only for the developing nations with young, growing populations and burgeoning industrial bases. In China, for instance, the economy must deal with raging inflation in import prices caused by soaring raw material costs in the world market. Inflation is also accelerating in China due to the Communist government's incessant push to build new factories in every city, even in the face of an industrial product surplus.
Here is what one noted observer, Adrian Van Eck, has written concerning China and its growing inflation problem: “Individual cities…each want their own steel mills, as a source of both local pride and of badly needed jobs. The same holds true for real estate development, much of it force-fed by speculators among the spoiled-brat generation of children of local, regional and national Communist party bosses. They have borrowed heavily from state banks and are now over-building in Shanghai, Beijing and other cities, some of it just to impress visitors to the August 2008 Olympics. All of this is causing rents and prices to fall.” [Source: Van Eck America-China Hotline, June 11, 2008, www.vanecktillman.com ]
Van Eck reports further that one reason for the 50% decline in China's stock market since October 2007 is because investors realistically understand that China is no longer a truly low-cost exporter. Bottom line: inflation of the true, monetary type is a major issue in China.
A report several weeks ago from Western Asset ( www.westernasset.com ) makes clear that inflation is a monetary phenomenon and the U.S. isn't currently suffering from it, despite media pronouncements to the contrary. In its report, “Is it Inflation?” Western Asset makes clear the distinction “between movements in the headline CPI and concept of inflation that is detailed in economic theory.”
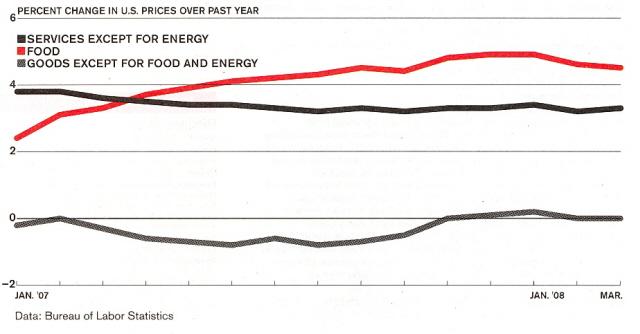
The report points out, “At present, prices are rising for energy and food products and for some products and services directly affected by these sectors. However, the cost increases induced by these price hikes are not being generally passed on to other product types. Prices in most other sectors are tranquil, even declining. Furthermore, one can't credibly make an argument that the energy and food price hikes are being sustained by Fed policy.”
The report asserts that if rising food and fuel prices were symptoms of U.S. inflation, nothing more than a “concerted Fed tightening would be required to dispel those problems” but that most measures of U.S. inflation show inflation to be actually decelerating despite the energy and food spikes. Moreover, total spending growth throughout the U.S. economy is also slowing, pointing to further decreases in inflationary pressures.
Even Business Week magazine, which tends to report the popular line that inflation is a major economic problem in the U.S., was forced to admit the inflation picture is “mixed.” In its May 12, 2008 issue, BW reported, “Although food and energy prices have gone sky-high, price increases of other goods and services are still contained. In many countries, core inflation – which leaves out food and energy – is actually lower than it was a year ago.”
The U.S. isn't the only major country experiencing the effects of soaring living costs combined with financial market deflation. According to an article in the October 24, 2007 issue of the Financial Times , “Cost of living goes up despite deflation” for Japan. Reports the FT, “Price rises – a novel phenomenon in a Japan that has been stuck in deflation for 10 years – are stirring anger. In the northern city of Sendai, 1,000 protesters marched recently against a planned 5 percent rise in the price of kerosene, which is used to heat homes.”
We keep hearing calls in the financial press for the Fed to tighten its monetary policy and hike short rates to prevent a widespread inflationary scenario from engulfing the country. Actually, a rate hike would be the worst thing the Fed could do right now and would do nothing to solve the “inflation” dilemma. We're also told relentless that the Fed has been injecting massive amounts of liquidity into the financial markets in order to prop the stock market and prevent another meltdown, and that this is feeding into energy prices. But the Western Asset report points out, “The fact is that actual liquidity growth has slowed down in the wake of the [credit] crisis and despite the Fed's actions.” That is, until now.
A short while back we looked at the Fed's response to the credit crisis as reflected in the domestic liquidity measurements. Up until lately the monetary base had been largely stagnant all year despite the Fed's emergency rate cut response to the subprime onslaught. Just recently, though, the Fed has amped up the liquidity and this increase in money has been reflected in a “breakout” in the monetary base chart.
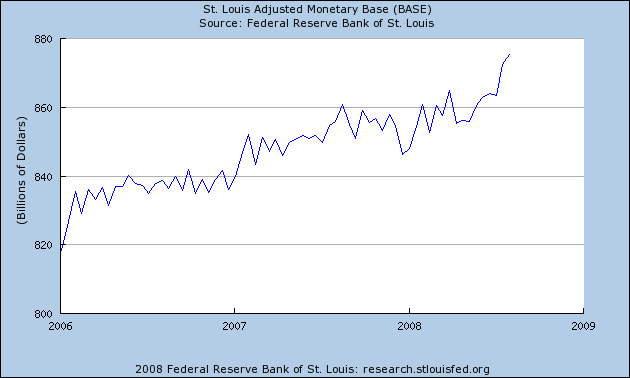
This is more good news that help is on the way and that the fires of the credit crisis are being rapidly extinguished. The road is being rapidly paved for the next cyclical bull market to begin and should accelerate in the fourth quarter once the 6-year cycle has completely bottomed.
The crisis mongers have achieved the desired level of maximum fear among both consumers and investors. Their goal has not been to destroy the capital markets, but rather to shake things up for financial gain and political power. To see what their goals were in creating the credit crisis, we need only view the results to date.
Getting back to the stock market outlook, to say that this year's negative sentiment has produced an “oversold” stock market would be an understatement. In fact, the oversold condition generated this summer has put the market in its most oversold internal condition since the end of the last major bear market in March 2003. I'd like to share with you the latest 10-month price oscillator reading for the S&P 500 index. This simple indicator measures the longer-term overbought and oversold position of the S&P and is useful at major tops and bottoms. It's updated at the start of each month, which means the latest update was today. Here's what the chart looks like as of August 1.
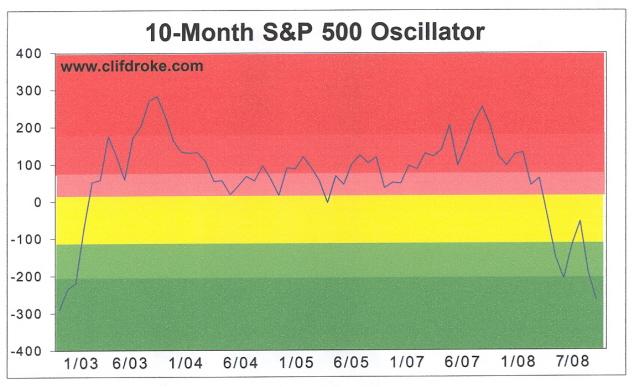
As you can see, this is the most “oversold” the S&P has been on a longer-term basis since the bear market low in early 2003. This is a bullish consideration for the months ahead, although it is not a pin-point entry and exit indicator. It can't call a bottom in and of itself but it can show you when the market internals are favorable for buying or selling. This indicator is showing that market internals are more favorable for buying stocks from an intermediate term standpoint.
The decline the U.S. stock market has had to suffer through was necessary to clear the way for the final “blow off” phase of the 2003-2009 bull market. This final advance is expected as the 6-year cycle bottoms and the 10-year cycle enters its final year of ascent. The “birthing pains” are nearly over and soon we'll have a new bouncing baby bull on our hands.
By Clif Droke
www.clifdroke.com
Clif Droke is the editor of the daily Gold & Silver Stock Report. Published daily since 2002, the report provides forecasts and analysis of the leading gold, silver, uranium and energy stocks from a short-term technical standpoint. He is also the author of numerous books, including 'How to Read Chart Patterns for Greater Profits.' For more information visit www.clifdroke.com
Clif Droke Archive |
© 2005-2022 http://www.MarketOracle.co.uk - The Market Oracle is a FREE Daily Financial Markets Analysis & Forecasting online publication.