


SPX Stocks Bull Market Update
Stock-Markets / Stock Market 2017 Jan 14, 2017 - 04:38 PM GMTBy: Tony_Caldaro

 The market started the week at SPX 2177. After a quiet session Monday the market inched up to SPX 2279 by Tuesday. Then Wednesday and Thursday the SPX declined to 2254. After that low the market rallied back to SPX 2279 on Friday and ended the week at 2275. For the week the SPX/DOW lost 0.25%, and the NDX/NAZ gained 1.0%. Economic reports for the week were positive. On the downtick: import prices, consumer sentiment, Q4 GDP est., plus weekly jobless claims rose. On the uptick: consumer credit, business/wholesale inventories, export prices, the PPI, retail sales, and the WLEI. Next week’s economic highlights include: industrial production, the FED’s beige book, and the NY/Philly FED.
LONG TERM: uptrend
Not much has changed on the long term count, with only a 2 point decline in the SPX and a 25 point trading range for the entire week. Major wave 1, of a five Major wave Primary III bull market, continues to unfold. Thus far Intermediate waves i and ii have completed, with Intermediate wave iii underway. Int. iii is subdividing into five Minor waves, with Minor waves 1 and 2 completed and Minor 3 underway. The question remains if Minor 3 is also subdividing into five Minute waves, since the current uptrend is much shorter than expected for all of Minor 3.
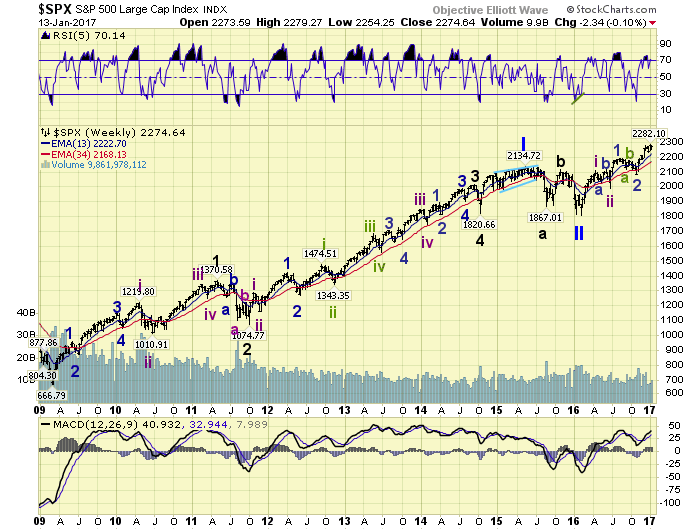
Thus far this uptrend has advanced 198 SPX points over the past 2 months. Minor wave 1 was 202 SPX points, and Intermediate wave i was 301 SPX points. That makes this uptrend currently the shortest of the three and not likely all of Minor 3, unless the uptrend extends in time and price. Two possible scenarios are noted below. One suggesting that it will extend (daily section), and one suggesting that it will subdivide (hourly section). We’ll let the market decide which one unfolds, as it makes little difference in the long-term trend.
MEDIUM TERM: uptrend
This uptrend, that began in early November at SPX 2084, has become quite choppy in recent weeks. Usually this is an indication of a completed uptrend, with a downtrend to follow. Sometimes it is only a period of consolidation after five waves up in an extended uptrend.
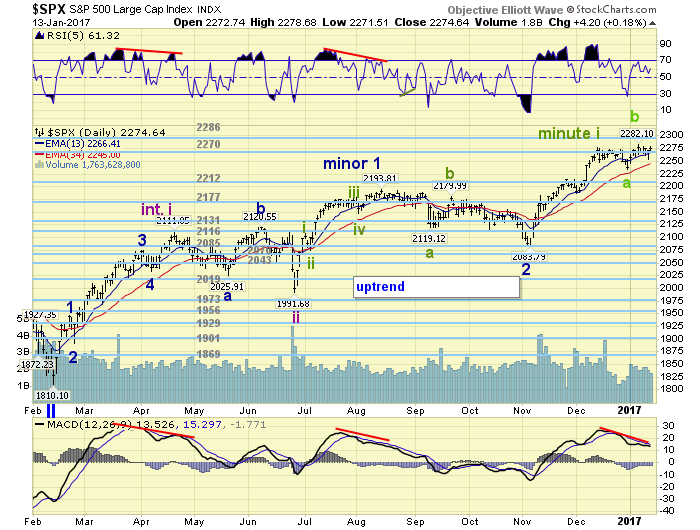
The sometimes scenario, that occurs when an uptrend is about to extend in time and price, is that the market is simply going through a consolidation period before it turns higher again. This would account for the choppiness with limited downside damage, and the repeated attempts to make new highs. We can count five waves up from SPX 2084 to SPX 2278, as noted in the above chart. After that we can count an ‘a’ wave down to SPX 2234, followed by a ‘b’ wave to SPX 2282. If completed, a ‘c’ wave down could find support at SPX 2234 again, for an irregular flat, or decline to the 2212 pivot range for an irregular zigzag. Under this scenario the market would have worked off its overbought condition, with limited damage in price, before it resumes to much higher prices and extends in time. Medium term support is at the 2270 and 2212 pivots, with resistance at the 2286 and 2321 pivots.
SHORT TERM
In the first week of January this uptrend reached the typical, for this bull market, two month duration. Since that SPX 2282 high the market has displayed a series of choppy waves, with a gradual drift to the downside until the low on Thursday at SPX 2254. After Thursday’s low the market rallied to SPX 2279 – within a few points of the all-time high again. It had hit that level on Tuesday as well.
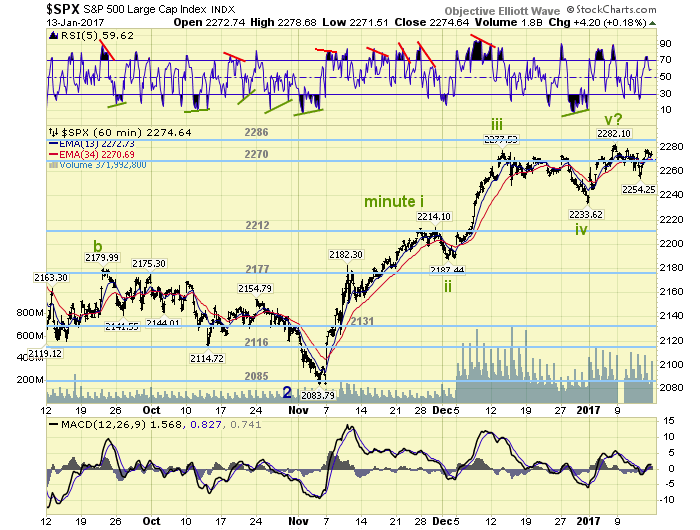
With the negative divergence in the daily MACD we suspect, under the usual scenario, that the market is forming an uptrend top before a downtrend kicks in. The typical decline for downtrends in this bull market is about 5%. This would place support around the SPX 2177 pivot. Under either scenario it would appear the choppiness will continue until the SPX retraces back to SPX 2234, or declines further. Short term support is at the 2270 pivot and SPX 2254, with resistance at the 2286 and 2231 pivots. Short term momentum ended the week just below overbought.
FOREIGN MARKETS
Asian markets were mixed on the week but gained 0.4%.
European markets were mostly higher and gained 0.3%.
The DJ World index gained 0.7% on the week.
COMMODITIES
Bonds look like they may have started an uptrend and gained 0.3% on the week.
Crude continues to uptrend but lost 3.0%.
Gold is in an uptrend and gained 1.9%.
The USD may have started a downtrend and lost 1.0% on the week.
NEXT WEEK
Monday: holiday. Tuesday: NY FED. Wednesday: the CPI, industrial production, the NAHB, the FED’s beige book, and speech from FED chair Yellen. Thursday: weekly jobless claims, housing starts, building permits, the Philly FED, and another speech from FED chair Yellen. Friday: options expiration. Best to your 3-day weekend and week!
CHARTS: http://stockcharts.com/public/1269446/tenpp
After about 40 years of investing in the markets one learns that the markets are constantly changing, not only in price, but in what drives the markets. In the 1960s, the Nifty Fifty were the leaders of the stock market. In the 1970s, stock selection using Technical Analysis was important, as the market stayed with a trading range for the entire decade. In the 1980s, the market finally broke out of it doldrums, as the DOW broke through 1100 in 1982, and launched the greatest bull market on record.
Sharing is an important aspect of a life. Over 100 people have joined our group, from all walks of life, covering twenty three countries across the globe. It's been the most fun I have ever had in the market. Sharing uncommon knowledge, with investors. In hope of aiding them in finding their financial independence.
Copyright © 2016 Tony Caldaro - All Rights Reserved Disclaimer: The above is a matter of opinion provided for general information purposes only and is not intended as investment advice. Information and analysis above are derived from sources and utilising methods believed to be reliable, but we cannot accept responsibility for any losses you may incur as a result of this analysis. Individuals should consult with their personal financial advisors.
Tony Caldaro Archive |
© 2005-2022 http://www.MarketOracle.co.uk - The Market Oracle is a FREE Daily Financial Markets Analysis & Forecasting online publication.