


Elliott Wave Analysis: Where the RUBBER Commodity Meets the Road
Commodities / Elliott Wave Theory Feb 09, 2017 - 04:59 PM GMTBy: EWI

 See why rubber prices bounced from an 11-year low to a 4-year high
There are nearly 50 commodity markets traded all over the world at any given time. That's one for every state in the United States.
So, how is an investor or trader supposed to know which of these markets to follow and which ones to dismiss?
Well, for our long-time Commodity Junctures editor Jeffrey Kennedy, the answer is simple: Don't wait for an Elliott wave pattern to develop on a market's price chart. But rather, choose price charts that already present discernible Elliott wave patterns.
Jeffery will be the first to admit -- sometimes, they show up in the most unlikely of places.
Back in November of 2016, Jeffrey (at a Commodity Junctures subscriber's behest) found an opportunity on the price charts of a market he never included before in his 20-plus years as EWI's senior commodity analyst --rubber.
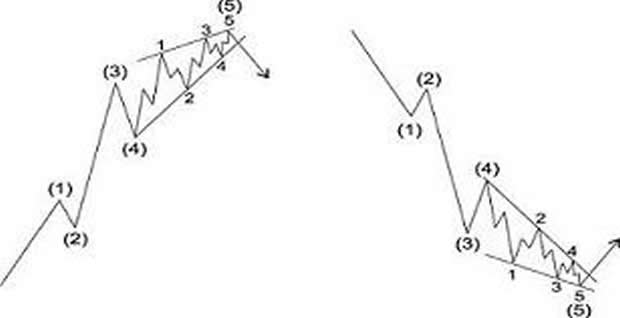
That opportunity took the shape of one of the most exciting Elliott wave patterns: the ending diagonal. It's a five-wave pattern labeled 1-5 that can only form in the final position of a wave sequence -- i.e., wave 5 of an impulse, or wave C of a correction.
Most importantly, when this pattern ends, it's followed by a swift and powerful reversal that retraces the entire length of the diagonal. Here's its idealized diagram, in bull and bear markets:
In his November 2016 Monthly Commodity Junctures video episode on rubber, Jeffrey made the case for a post-diagonal thrust UP for the long-suffering rubber market:
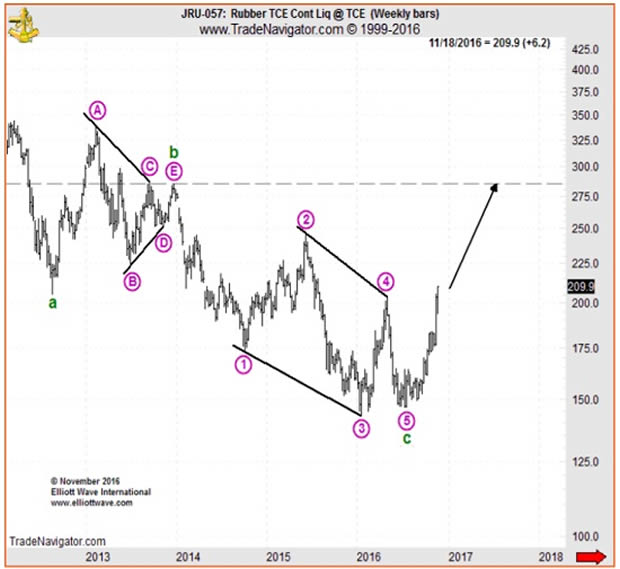
"We'll be discussing a market that I've actually never spoken about before. I was surprised to find very high quality wave patterns on the charts. This is how we can label the weekly price chart of rubber.
"An ending diagonal in the wave c position. Subsequent price action has been quite impulsive to the upside. Now, as you know, whenever an ending diagonal terminates, it tends to resolve quite swiftly and quite sharply back to beyond the origin of the pattern, and that comes into play about 285.5.
"As we move into 2017, I suspect that we will have retraced that entire move to the downside that essentially took two-and-a-half years to form."
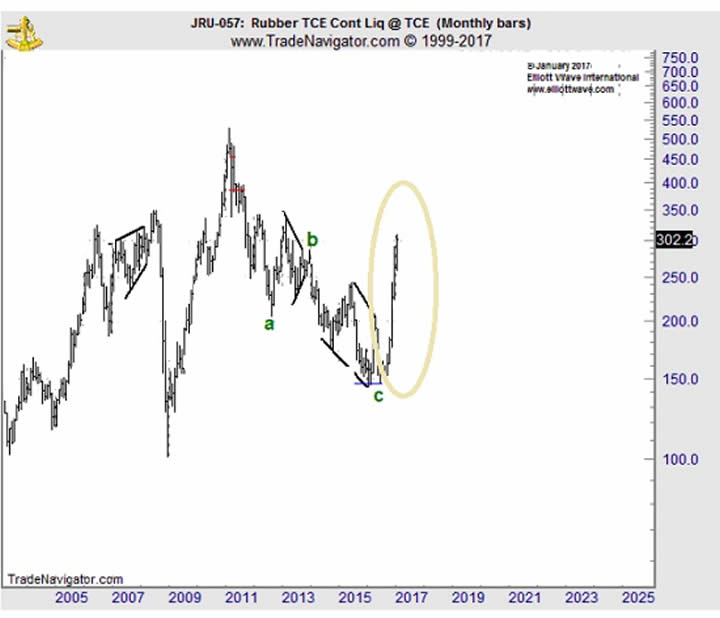
From there, rubber prices made a serious commitment to the upside, soaring to a four-year high on January 26.
Now, according to mainstream analysis, rubber's shocking rebound off 11-year lows is the result of weeks' long floods in Thailand, the world's top rubber producer.
You, however, now know the real story: Rubber's rally began long before the sky's opened up in Southern Thailand. It kicked off in late November, as the result of a complete Elliott wave ending diagonal pattern.
When it comes to choosing the right commodity market at the right time, the independent perspective of Elliott wave analysis goes a long way.
Free eBook:
|
This article was syndicated by Elliott Wave International and was originally published under the headline Elliott Wave Analysis: Where the RUBBER Meets the Road. EWI is the world's largest market forecasting firm. Its staff of full-time analysts led by Chartered Market Technician Robert Prechter provides 24-hour-a-day market analysis to institutional and private investors around the world.
© 2005-2022 http://www.MarketOracle.co.uk - The Market Oracle is a FREE Daily Financial Markets Analysis & Forecasting online publication.