


Another Stock Market Bubble? Bring it On!
Stock-Markets / Stock Market 2017 Feb 24, 2017 - 11:04 AM GMTBy: Clif_Droke

 Anytime the Dow makes a new high you can be reasonably assured of hearing the B-word bounced around in the media. Memories of the last bubble are still vivid and painful enough to trigger flashbacks of the bubble's collapse. It's only natural then that investors fear a return of irrational exuberance. Despite these fears, the evidence of a newly formed bubble is surprisingly lacking, as we'll uncover here.
Asset manager Jeremy Grantham famously defined a bubble as any asset whose price has moved at least two standard deviations above its longer-term statistical mean, or norm. This definition is too rigid, however, and can sometimes be misapplied to see bubbles where none actually exist. Markets can sometimes exceed the 2 standard deviation rule in non-bubble environments, as when the utilities sector last year experienced a 3 standard deviation event.
This definition also is overly reliant on statistics and is lacking in the psychology department. Investor psychology, after all, is a primary driving force of the pricing mechanism in all free markets. What Grantham's 2 standard deviation event rule fails to consider is that if a market experiences a record-breaking and sustained run-up, it can sometimes occur without widespread participation by small traders and investors. And without large scale participation among retail traders the psychology of a bubble is lacking, i.e. there is no bubble.
The latest rally in the major stock market averages has once again fueled talk of a mania for equities in the popular press. As discussed in previous commentaries, though, there is as yet no evidence of widespread direct participation in the equity market by small investors. Much of the movement behind the rally to new highs is courtesy of institutional activity, with the public participating only indirectly via retirement savings funds. Nowhere to be seen is the incessant preoccupation with day trading, swing trading and stock picking which were symptoms of the last two bubbles.
One explanation for this startling lack of bubble psychology despite the all-time highs in stock prices is the K-wave. Readers of this commentary should be familiar with this most basic of all long-term economic cycles, which answers roughly to the 60-year equity market cycle. The K-wave deflationary descent bottomed in 2014 based on the Kress cycle count. K-waves are often divided into four sections or "seasons" with each section being assigned a season of the year (e.g. winter, spring, summer, fall). The following graph was devised many years ago by P.Q. Wall and does an admirable job of describing the K-wave seasons.
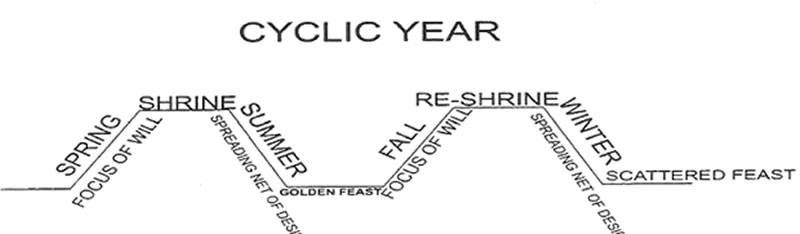
If we assume that K-wave winter season ended in 2014, we're now in the early phase of K-wave spring. Early spring can easily be confused with winter due to the occasional freeze or snow storm that sometimes happens during the transition period between the two seasons. But as the season progresses the signs of new life and warmth that always accompany spring gradually become more evident. In that same vein, the last couple of years might easily have been confused with winter due to periodic outbursts of deflation in the global economy. Yet we're starting to see unmistakable signs that K-wave spring has truly sprung, even in the weakest performing foreign markets.
To take one example, China's stock market is starting to show renewed signs of life after being in a bear market the last two years. China has also recently begun trying to increase its economic growth by providnig plenty of credit. As Dr. Ed Yardeni has observed, "During January, total 'social financing' rose by a record $542.3 billion. That's not on a y/y basis, but rather on a m/m basis! On a y/y basis, social financing totaled $2.7 trillion over the past 12 months through January. Bank loans, which are included in social financing, rose $335.7 billion during January m/m and $1.8 trillion over the past 12 months."
The emerging markets have experienced a similar rebound along with several euro zone markets. As the U.S. leads the rest of the world out of global recession, there can be no denying that the K-wave is beginning to work its spring-time magic.
The aggressive policy stance by China's central bank has led to worries that China's real estate and stock markets may soon experience another bubble. This in turn has added to fears that the U.S. will soon experience another bubble event in the stock market. This need not concern us, however, since painful memories of the credit crisis are still strong enough among central bankers to prevent a bubble from forming, let alone get out of control. Even China's last taste of an equity market bubble ended prematurely when frightened policy makers quickly tightened money and credit in fear of the consequences.
Now let's assume for a minute, though, that a bubble was allowed to form in the U.S. equity market this year. Would this be such a bad thing? Considering that the biggest advances in technological progress and development, to say nothing of widespread prosperity, have occurred during bubbles it's easy to answer that question in the negative. While the naysayers focus on the negative aspects of a bubble's implosion they neglect to mention that even after the inevitable popping, society is still immeasurably better off than before the bubble began. Indeed, a bubble might be just what is needed to put the U.S. economy back on the right track for vigorous growth.
It should be added that when it comes to economic policy, it's always best to err on the side of too much growth than on too much austerity. The events in Europe of recent years serve as a stark reminder of this fact. Thus whenever fears of a bubble are discussed, it would do policy makers well to consider that the benefits of a loose monetary policy always outweigh that of a tight one.
Probably the biggest argument used by the bubblemongers right now is the chart of the NASDAQ 100 Index (NDX). This chart can easily be used to justify the fear of an incipient bubble, yet the investor psychology and mass participation factors are curiously missing right now.
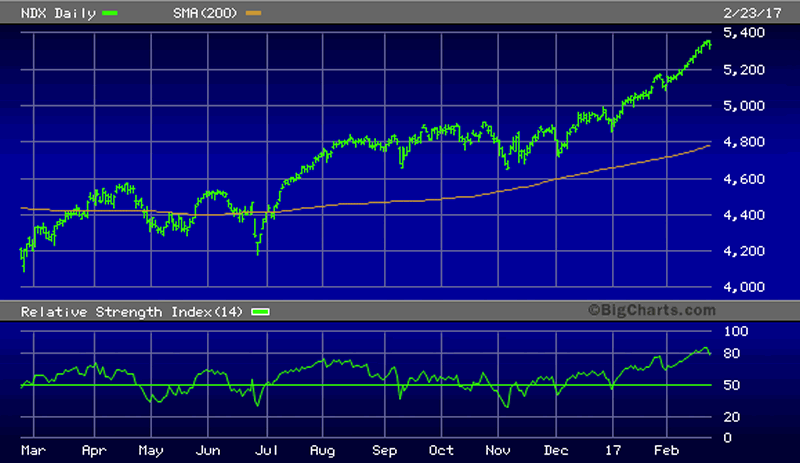
Before we arrive at the bubble stage, we should see increased interest bordering on obsession among small investors as the stock market becomes a primary focus among the masses. As this hasn't yet happened, the inescapable conclusion is that the long-term bull market hasn't reached bubble proportions yet and therefore has a ways to go before expiring.
Mastering Moving Averages
The moving average is one of the most versatile of all trading tools and should be a part of every investor's arsenal. Far more than a simple trend line, it's also a dynamic momentum indicator as well as a means of identifying support and resistance across variable time frames. It can also be used in place of an overbought/oversold oscillator when used in relationship to the price of the stock or ETF you're trading in.
In my latest book, Mastering Moving Averages, I remove the mystique behind stock and ETF trading and reveal a simple and reliable system that allows retail traders to profit from both up and down moves in the market. The trading techniques discussed in the book have been carefully calibrated to match today's fast-moving and sometimes volatile market environment. If you're interested in moving average trading techniques, you'll want to read this book.
Order today and receive an autographed copy along with a copy of the book, The Best Strategies for Momentum Traders. Your order also includes a FREE 1-month trial subscription to the Momentum Strategies Report newsletter: http://www.clifdroke.com/books/masteringma.html
By Clif Droke
www.clifdroke.com
Clif Droke is the editor of the daily Gold & Silver Stock Report. Published daily since 2002, the report provides forecasts and analysis of the leading gold, silver, uranium and energy stocks from a short-term technical standpoint. He is also the author of numerous books, including 'How to Read Chart Patterns for Greater Profits.' For more information visit www.clifdroke.com
Clif Droke Archive |
© 2005-2022 http://www.MarketOracle.co.uk - The Market Oracle is a FREE Daily Financial Markets Analysis & Forecasting online publication.