


NG #F (Natural Gas) Rally is Not Over Yet
Commodities / Natural Gas Apr 07, 2017 - 02:01 PM GMT

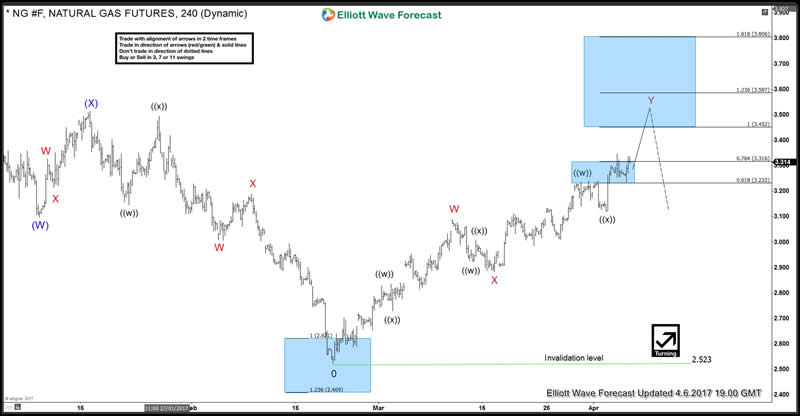
NG #F (Natural Gas) has been rallying since forming a low on 2/22 (2.523). Rally is unfolding as a WXY or double three Elliott Wave Structure where wave W completed at 3.089 and wave X completed at 2.882. Up from red X low, Natural Gas is showing 5 swings up which means the sequence is incomplete and while above black ((x)) low at 3.121, rally should continue higher towards 3.452 – 3.587 to complete 7 swings sequence from red X low. This would also complete a WXY structure from 2.523 low and then we should see a 3 wave pull back in NG #F either to correct the cycle from 2.523 low or at least from red X low.
NG #F (Natural Gas) 4 Hour Elliott Wave Chart
NG #F (Natural Gas) 1 Hour Elliott Wave Chart
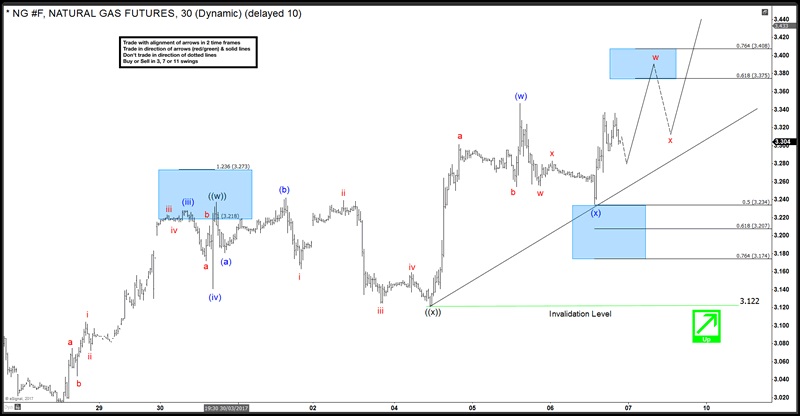
Rally to 3.237 completed wave ((w)) which was followed by a FLAT correction to 3.121 which completed wave ((x)). Up from there, it rallied in 3 waves to 3.347 to complete wave (w) and then did a 3 wave pull back to 50 Fibonacci retracement level at 3.234 which we think completed wave (x). Today, Natural Gas started rallying again and now it needs to break above 3.347 (w) high to confirm wave (x) completed at 3.234 and wave (y) higher is in progress. Until 3.347 high doesn’t break a test of 3.224 – 3.197 area can’t be ruled out to complete a double three correction in wave (x). Break above 3.347 would initially expose a test of 3.375 – 3.408 area and from there we can see another 3 wave pull back followed by the next leg higher towards 3.461 – 3.514 area which is the 100 – 123.6 Fibonacci extension area of (w)-(x) and will coincide with 100% Fibonacci extension of higher degree red W-X at 3.452.
If you enjoyed this article, feel free to take a look at our Technical Blog and also check the Chart of The Day .
For further information on how to trade forex, indices, commodities and stocks using Elliott Wave technique , try us 14 days for FREE . You will get access to our Professional Elliott Wave analysis in 4 different time frames, Daily Elliott Wave Setup Videos , Live Trading Room and 2 Live Analysis Session done by our Expert Analysts every day, 24 hour chat room support, Weekly Technical videos and much more so if you are not a member yet, use this opportunity and sign up to get your FREE trial
By Ayoub Ben Rejeb
https://elliottwave-forecast.com
ElliottWave-Forecast has built its reputation on accurate technical analysis and a winning attitude. By successfully incorporating the Elliott Wave Theory with Market Correlation, Cycles, Proprietary Pivot System, we provide precise forecasts with up-to-date analysis for 52 instruments including Forex majors & crosses, Commodities and a number of Equity Indices from around the World. Our clients also have immediate access to our proprietary Actionable Trade Setups, Market Overview, 1 Hour, 4 Hour, Daily & Weekly Wave Counts. Weekend Webinar, Live Screen Sharing Sessions, Daily Technical Videos, Elliott Wave Setup .
Copyright © 2017 ElliottWave-Forecast - All Rights Reserved Disclaimer: The above is a matter of opinion provided for general information purposes only and is not intended as investment advice. Information and analysis above are derived from sources and utilising methods believed to be reliable, but we cannot accept responsibility for any losses you may incur as a result of this analysis. Individuals should consult with their personal financial advisors.
© 2005-2022 http://www.MarketOracle.co.uk - The Market Oracle is a FREE Daily Financial Markets Analysis & Forecasting online publication.