


Stock Market Trend Forecast and Fear Trading
Stock-Markets / Stock Market 2017 May 22, 2017 - 11:40 AM GMTBy: Chris_Vermeulen

 The broad US stock market last week took a tumble sending a massive wave of fear through investors’ minds. On Wednesday May 17th the S&P 500 index plummeted 1.7% causing the fear index to jump a whopping 48% in a single session.
What does this mean and what should we expect going forward? I don’t see the recent drop as being anything to worry about at this point. It’s important to remember that some of that larges drops in stocks happen during a bull market (rising trend). In fact, these stand out sharp drops on the charts are nothing more than the market trying to buck investors out of the bull market (scare them out) before it continues higher.
The Market Trend Forecast Prediction
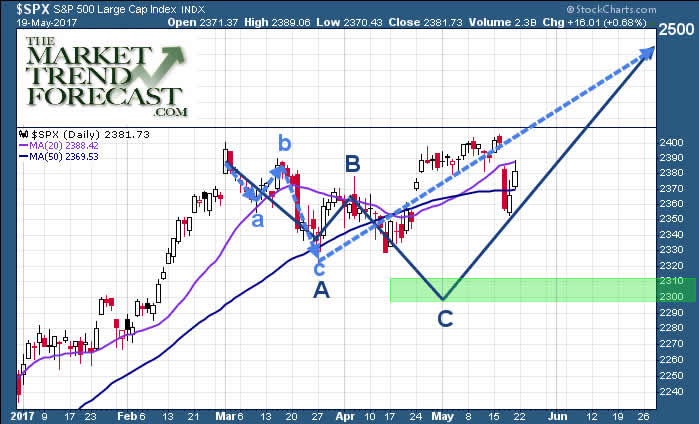
Look at the chart below courtesy of TMTFwebsite. This chart was originally posted back in April with two potential price paths for the SP500 to reach the next price target of 2500. The overall forecast points to higher prices this summer with the potential of a major top forming late July or August.
I should caution that I believe there is potential for another washout low with the SPX dropping to the 2300 level still to reach that Elliott Wave level. Even if this level is hit, the overall market trend will remain bullish and would be fully rejuvenated for the next big leg higher.
Fade the Fear – Swing Trading Fear
Let’s face it, we all know the feeling of when so one jumps out and scares us. The surge of blood pressure, adrenaline, and how our body jolts into action is a natural human response.
Fear among investors is almost identical when there is a sharp drop in price. Other than the fact that investors don’t typically scream, put up their fists and/or run away, instead they hit the SELL button to close out losing position in order to remove the fear/pain of further losses.
Typically, most traders panic out of positions at the same time (within a few trading days) and this sentiment shift can be seen as a price spike on the VIX chart.
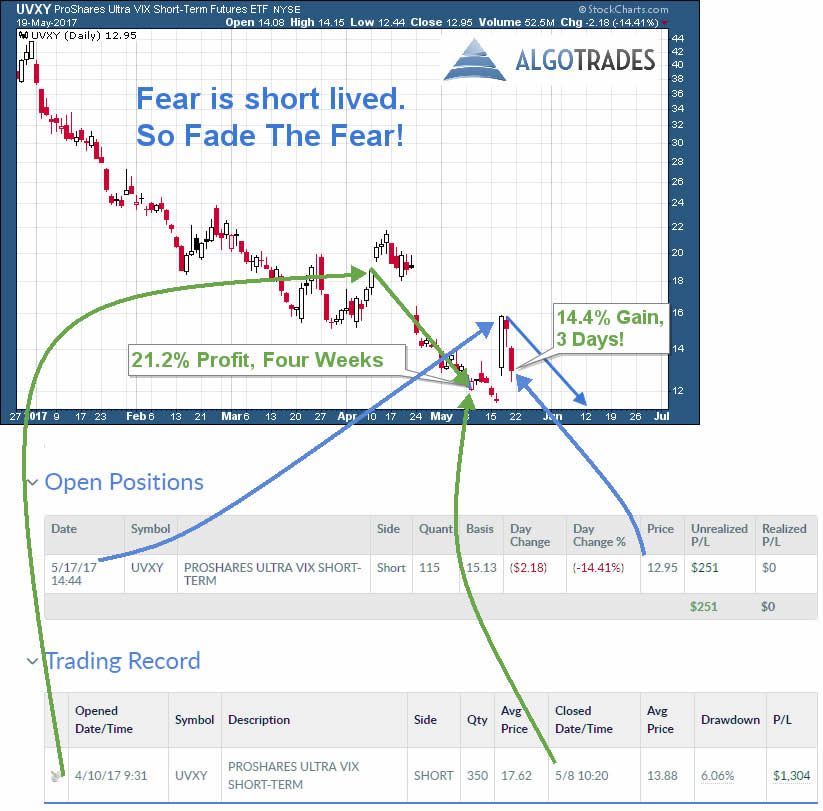
Below you will see a chart and recent trades executed based on a strategyI have been testing for some time and recently started trading live. It is based around the fact that fear/panic is very short lived and fades away quickly. It is also based on the fact that leveraged VIX ETFs also fall in value over time because of how they have been designed. This allows us to short the long leveraged VIX ETF adding further potential gains to a falling VIX price.
Momentum Trade Extreme Panic & Greed
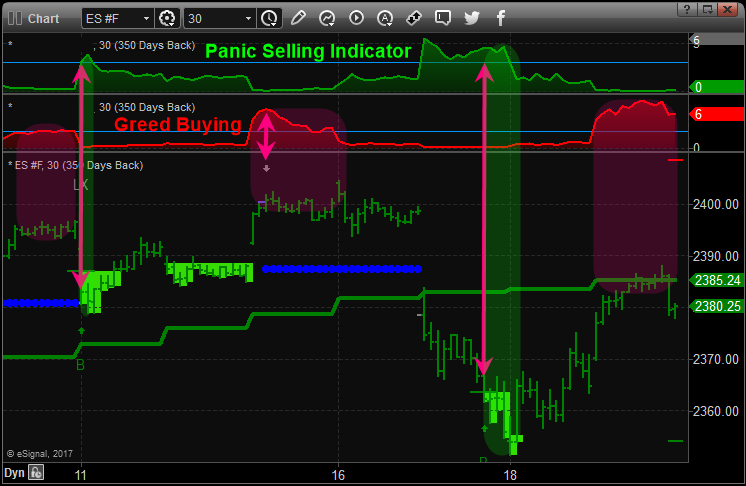
The two previous charts above were based on daily charts of the markets. This portion shows you the potential turning points and trade setups each week based on the 30-minute intraday chart. Some weeks can provide multiple trade setups if property identified.
The below chart is the SP500 continuous contract futures chart which I created and use for identifying turning points and trades in the broad market using SPY, SSO, SDS, or ES Mini Futures. This chart and its analysis also helps me identify when the VIX (Fear index) should be topping or bottoming as well.
Obviously, these moves are small and quick only lasting a day or two. But keep in mind if you have high probability trade setups and apply leverage like ES mini futures one can profit handsomely from small but frequent moves like this ranging between $250 – $1500 profit.
In Conclusion:
In short, the longer-term trend for US equities remains up (bullish). Based on the short-term 30-minute chart above stocks are a little overbought so a small pullback or pause is likely. While this week is a full trading week, it is going into a holiday weekend which typically favors higher stock prices by the closing bell on Friday.
In my next article, I plan to share with you what gold, silver, and miners are setting up for and it’s likely bigger and in the opposite direction than you think, stay tuned!
Finally, I want to mention that I will be getting back to my roots and passion in terms of article content. The past two years I changed gears to write more about the global economy and news. Recently I realized that I just don’t enjoy writing about these types of thing. Its all doom, gloom, corruption, and ridiculous actions but leaders around the world and not fun to write or read. So, I am thrilled to say that things will be back to how they were: Simple, technical analysis based forecasts and weekly trade setups.
Learn more about my daily price forecasts and turning points video: www.TheGoldAndOilGuy.com
Chris Vermeulen
www.TheGoldAndOilGuy.com – Daily Market Forecast Video & ETFs
www.ActiveTradingPartners.com – Stock & 3x ETFs
Chris Vermeulen is Founder of the popular trading site TheGoldAndOilGuy.com. There he shares his highly successful, low-risk trading method. For 7 years Chris has been a leader in teaching others to skillfully trade in gold, oil, and silver in both bull and bear markets. Subscribers to his service depend on Chris' uniquely consistent investment opportunities that carry exceptionally low risk and high return.
Disclaimer: Nothing in this report should be construed as a solicitation to buy or sell any securities mentioned. Technical Traders Ltd., its owners and the author of this report are not registered broker-dealers or financial advisors. Before investing in any securities, you should consult with your financial advisor and a registered broker-dealer. Never make an investment based solely on what you read in an online or printed report, including this report, especially if the investment involves a small, thinly-traded company that isn’t well known. Technical Traders Ltd. and the author of this report has been paid by Cardiff Energy Corp. In addition, the author owns shares of Cardiff Energy Corp. and would also benefit from volume and price appreciation of its stock. The information provided here within should not be construed as a financial analysis but rather as an advertisement. The author’s views and opinions regarding the companies featured in reports are his own views and are based on information that he has researched independently and has received, which the author assumes to be reliable. Technical Traders Ltd. and the author of this report do not guarantee the accuracy, completeness, or usefulness of any content of this report, nor its fitness for any particular purpose. Lastly, the author does not guarantee that any of the companies mentioned in the reports will perform as expected, and any comparisons made to other companies may not be valid or come into effect.
Chris Vermeulen Archive |
© 2005-2022 http://www.MarketOracle.co.uk - The Market Oracle is a FREE Daily Financial Markets Analysis & Forecasting online publication.