


EIA Weekly Report and Crude Oil
Commodities / Crude Oil Aug 19, 2017 - 06:48 PM GMTBy: Nadia_Simmons

 Although the EIA weekly report showed a larger-than-expected decline in crude oil inventories, the price of the commodity declined sharply after news that U.S. crude oil production increased. Thanks to these circumstances, light crude lost 1.62% and closed the day under important support. What does it mean for the black gold?
Yesterday, the Energy Information Administration reported that crude oil inventories dropped by over 8.9 million barrels in the week ended Aug 11, easily beating expectations of a draw of around 3 million barrels. Despite these bullish numbers (and the fact that it was the seventh straight week of declines in crude oil inventories), the report also showed that gasoline inventories rose by 22,000 barrels and distillate stockpiles rose by 702,000 barrels, missing analysts’ forecasts of a draw. On top of that, the EIA also showed that crude oil production increased to 9.502 million barrels per day, which renewed worries over the supply glut and pushed the price of light crude below $47 and important support. What does it mean for the black gold?
Crude Oil’s Technical Picture
Let’s take a closer look at the charts and find out (charts courtesy of http://stockcharts.com).
On Tuesday, we wrote the following:
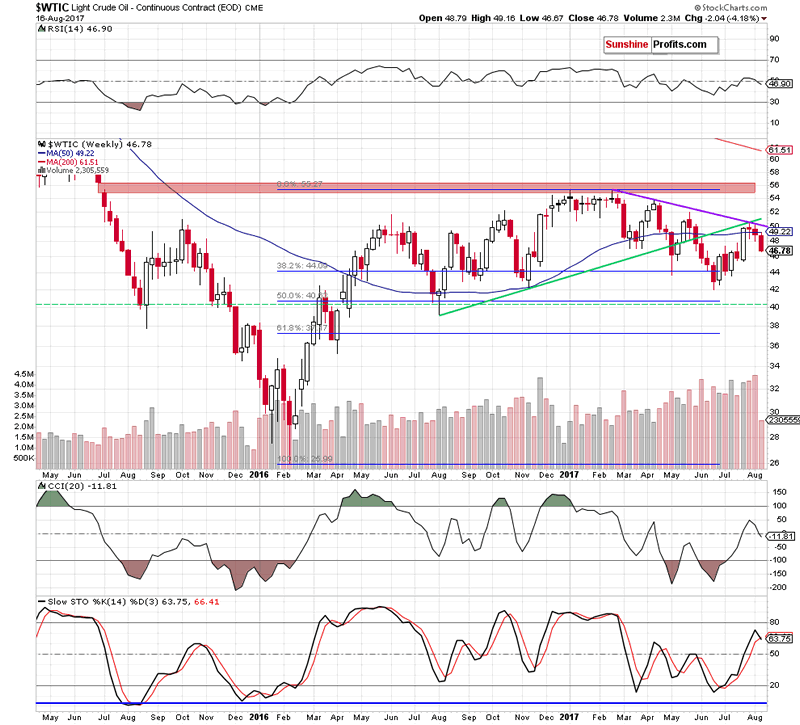
(…) crude oil extended last week losses. What’s interesting, when we take a closer look at the above chart, we can notice that the commodity increased slightly before the decline, which looks like a verification of the breakdown under the 50-week moving average (a bearish development).
Looking at the medium-term chart, we see that the above-mentioned verification of the breakdown under the 50-week moving average encouraged oil bears to act and resulted in further deterioration. Additionally, the CCI reversed, while the Stochastic Oscillator generated the sell signal, increasing the probability of declines in the coming week(s).
What impact did this drop have on the very short-term picture? Let’s examine the daily chart and find out.
Quoting our Tuesday’s alert:
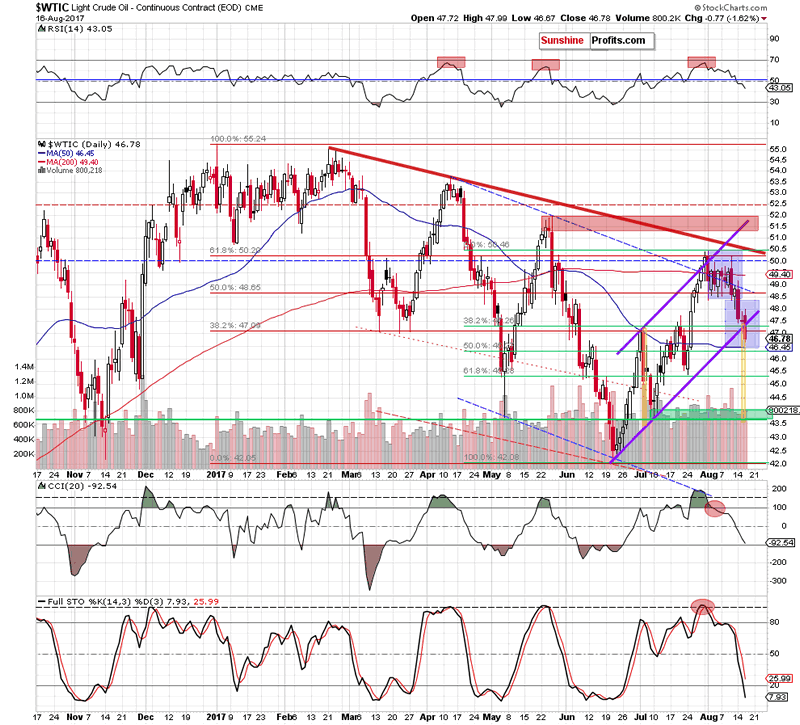
(…) Thanks to yesterday’s decline light crude dropped below the lower border of the blue consolidation, which together with the sell signals suggests further deterioration and the realization of our last week’s bearish scenario:
(…) the next downside target for bears will be around $47.25, where the 38.2% Fibonacci retracement based on the entire recent upward move is. However, taking into account all negative above-mentioned factors, we think that light crude will move even lower and test (…) the 50% Fibonacci retracement (…)
Why? Because in this area the size of the downward move will correspond to the height of the blue consolidation. Nevertheless, before we see the realization of this scenario oil bears will have to push the price of the commodity below the lower border of the purple rising trend channel and the above-mentioned retracement.
From today’s point of view, we see that the situation developed in line with our last week’s assumptions and crude oil moved lower once again, breaking not only below the 38.2% Fibonacci retracement, but also under the lower border of the purple rising trend channel. This bearish development suggests further deterioration and a test of the 50% Fibonacci retracement and the 50-day moving average (currently at $46.45) later in the day.
But will this support area stop oil bears for longer? In our opinion, it is quite doubtful. Why? Firstly, the medium-term picture suggests further declines (verification of the breakdown and the current position of the indicators). Secondly, the sell signals generated by the daily indicators remain in cards, supporting lower prices of light crude. Thirdly, yesterday’s decline materialized on higher volume, which confirms oil bears’ strength. Fourthly, and most importantly, yesterday’s drop took the price of the black gold below the lower border of the purple rising trend channel, which opened the way even to the green support zone seen on the daily chart (around $43.65-$44.23 the size of the downward move will correspond to the height of the trend channel).
However, before we see crude oil at these levels, oil bears will have to break under $45.40, where the late July low and the 61.8% Fibonacci retracement are.
Finishing today’s alert, please take a closer look at the very short-term picture of the oil-to-gold ratio.
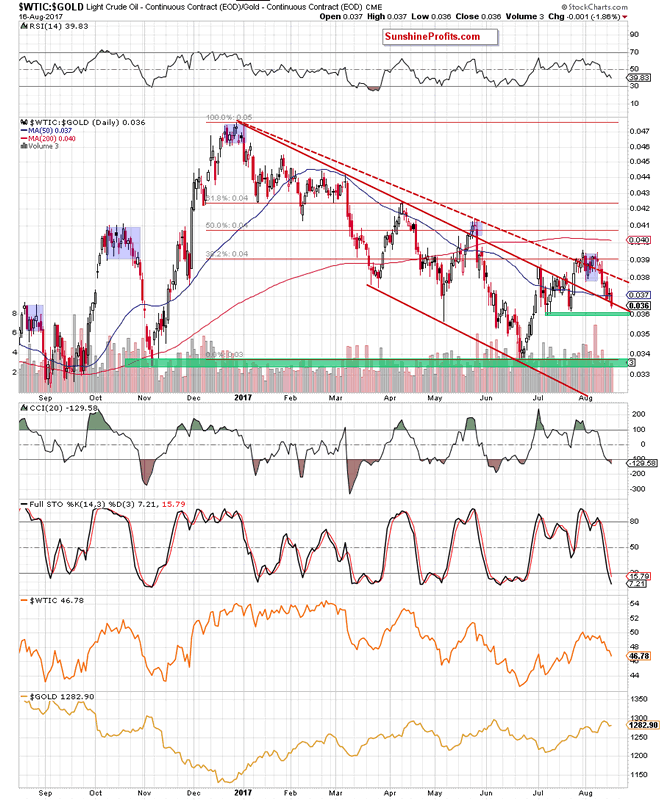
The first thing that catches the eye on the above chart is an invalidation of the breakout above the upper border of the red declining trend channel. This is a bearish development, which suggests further deterioration of the ratio in the coming days.
How such price action could affect crude oil? We believe that the best answer to this question will be the quote from our Oil Trading Alert posted on July 31:
(…) Taking into account the fact that positive correlation between the ratio and the commodity is still in cards, we believe that declines in the ratio will likely translate into lower prices of crude oil in the coming week(s).
Summing up, short profitable positions continue to be justified from the risk/reward perspective as crude oil extended losses, breaking below the 38.2% Fibonacci retracement and the lower border of the purple rising trend channel, which opened the way to lower levels. Additionally, the size of volume increased and the sell signals generated by the indicators remain in cards, suggesting further deterioration in the coming days.
Very short-term outlook: bearish
Short-term outlook: bearish
MT outlook: mixed
LT outlook: mixed
If you enjoyed the above analysis and would like to receive free follow-ups, we encourage you to sign up for our daily newsletter – it’s free and if you don’t like it, you can unsubscribe with just 2 clicks. If you sign up today, you’ll also get 7 days of free access to our premium daily Oil Trading Alerts as well as Gold & Silver Trading Alerts. Sign up now.
Thank you.
Nadia Simmons
Forex & Oil Trading Strategist
Przemyslaw Radomski
Founder, Editor-in-chief
Sunshine Profits: Gold & Silver, Forex, Bitcoin, Crude Oil & Stocks
Stay updated: sign up for our free mailing list today
* * * * *
Disclaimer
All essays, research and information found above represent analyses and opinions of Nadia Simmons and Sunshine Profits' associates only. As such, it may prove wrong and be a subject to change without notice. Opinions and analyses were based on data available to authors of respective essays at the time of writing. Although the information provided above is based on careful research and sources that are believed to be accurate, Nadia Simmons and his associates do not guarantee the accuracy or thoroughness of the data or information reported. The opinions published above are neither an offer nor a recommendation to purchase or sell any securities. Nadia Simmons is not a Registered Securities Advisor. By reading Nadia Simmons’ reports you fully agree that he will not be held responsible or liable for any decisions you make regarding any information provided in these reports. Investing, trading and speculation in any financial markets may involve high risk of loss. Nadia Simmons, Sunshine Profits' employees and affiliates as well as members of their families may have a short or long position in any securities, including those mentioned in any of the reports or essays, and may make additional purchases and/or sales of those securities without notice.
© 2005-2022 http://www.MarketOracle.co.uk - The Market Oracle is a FREE Daily Financial Markets Analysis & Forecasting online publication.