


Is Silver Turning?
Commodities / Gold and Silver 2017 Oct 09, 2017 - 05:48 PM GMTBy: The_Gold_Report

 Technical analyst Clive Maund discusses movements in the silver price. The last Silver Market update almost a month ago called the intermediate top within a day, as you may recall, and it has back to the extent predicted in that update.
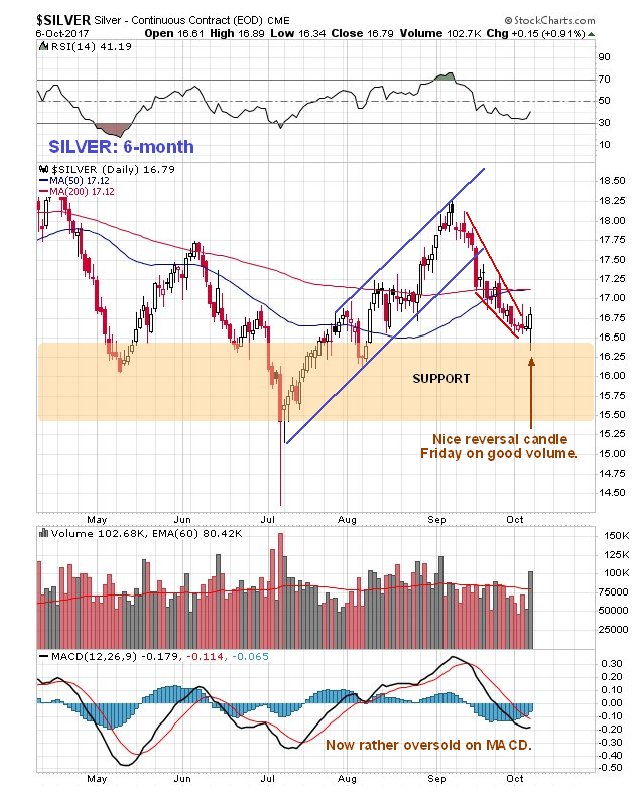
There was more evidence of a turn in silver than gold on Friday, when a more obvious reversal candle appeared on its chart. On the 6-month chart we can see that a long-tailed candle occurred that approximates to a bull hammer where the price closed not far off the day's highs on the biggest volume for over a month. After its recent reaction this certainly looks like a reversal, especially as the downtrend channel has been converging. The earlier overbought condition has more than fully unwound and the price has dropped back into a zone of support.
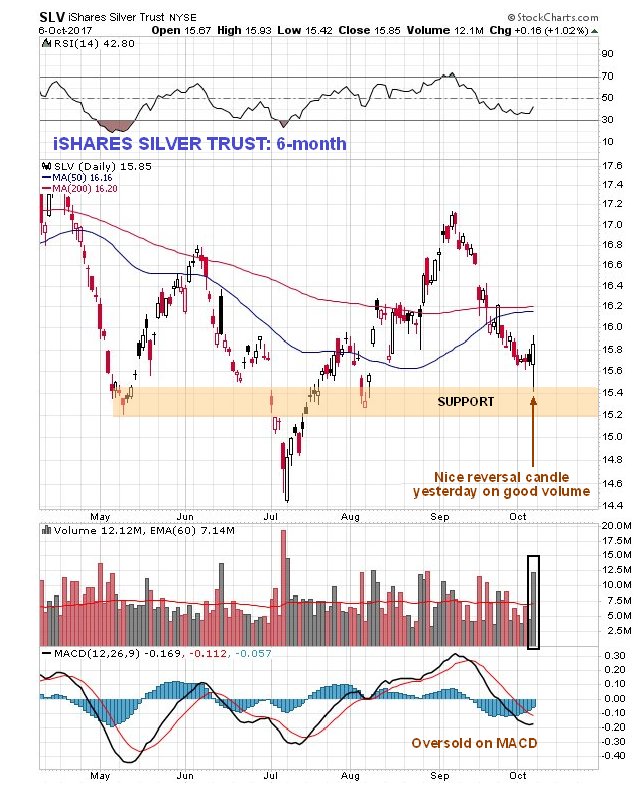
There was an even more pronounced reversal candle on Friday in silver proxy iShares Silver Trust. . .
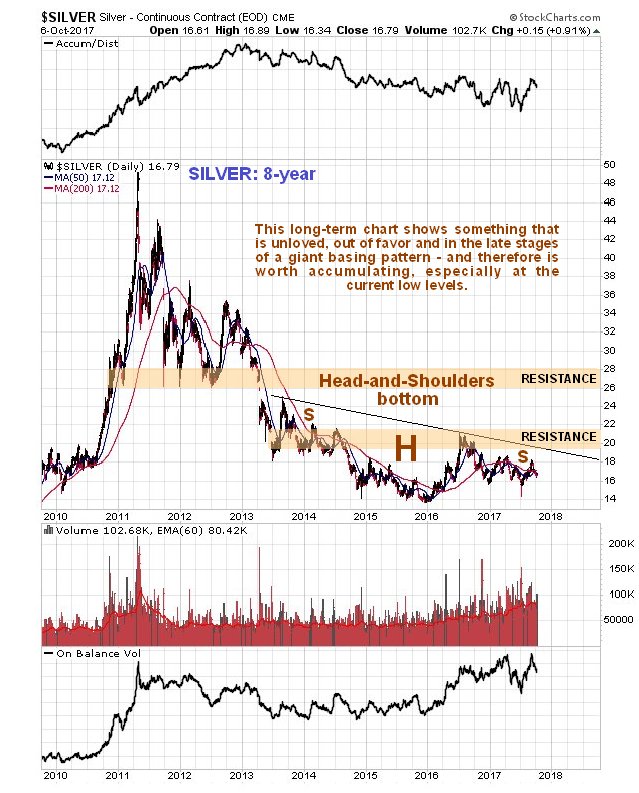
Like gold, silver is marking out a giant Head-and-Shoulders bottom pattern, but in silver's case it is downsloping as we can see on its 8-year chart below, which reflects the fact that silver tends to underperform gold at the end of sector bear markets and during the early stages of sector bull markets. Prolonged underperformance by silver is therefore a sign of a bottom. This chart really does show how unloved silver is right now, but although the price has drifted slightly lower over the past several years, volume indicators have improved, especially this year, a positive sign. A break above the neckline of the pattern, the black line, will be a positive development, and more so a break above the band of resistance approaching the 2016 highs. Once it gets above this it will have to contend with a quite strong zone of resistance roughly between $26 and $28. Silver is among the most unloved of all metals, a situation that is not expected to continue, partly because silver bugs are manic-depressive and they have been depressive for a long time, meaning that it surely won't be all that long until they are on the rooftops singing Happy Days are Here Again.
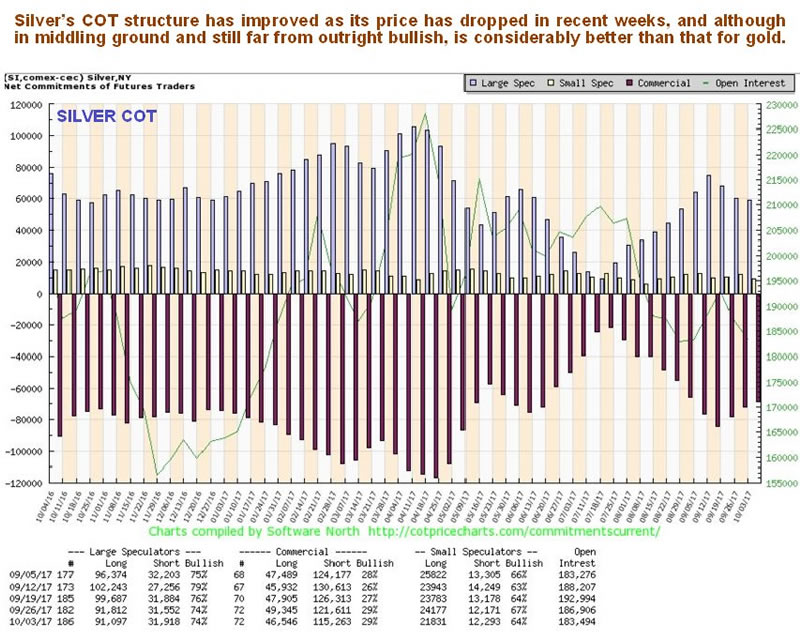
As with gold, silver's COT structure has improved in recent weeks as the price has dropped, and although readings are still far from levels that can be described as outright bullish, they are considerably better than those for gold, which could be a sign that silver is set to outperform gold at last. . .
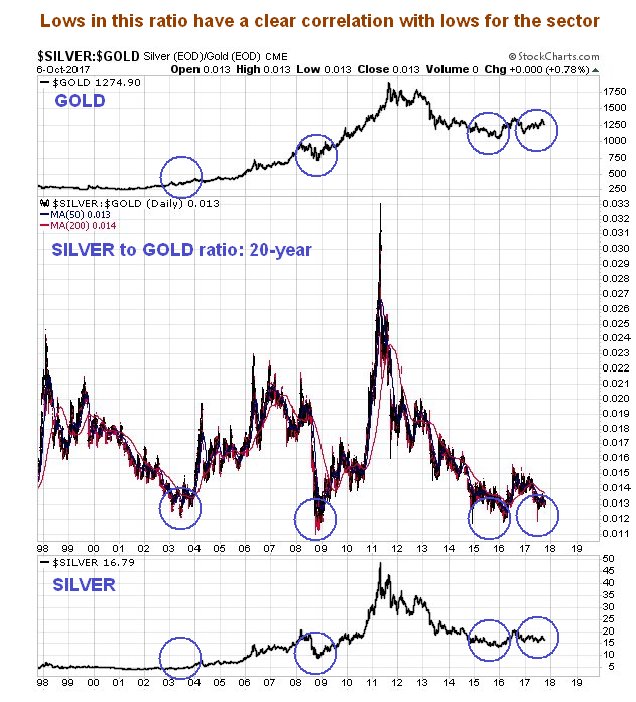
Extreme lows in the silver/gold ratio are reliable indicators of either a sector bottom or they can occur during the early stages of a sector bull market, as can be seen on the long-term silver over gold chart shown below, which goes back to late 1997. When a low in this ratio occurred in 2003, the sector was already in a bull market, but as we can see, it had much further to run. The next major low followed the 2008 market crash. More recently the ratio plumbed very low levels again at the end of 2014 and early in 2016, which marked the sector bottom after the brutal bear market from the 2011 highs. Right now it is only a whisker above these lows, which is a strong sign that another bull market is just around the corner.
Clive Maund has been president of www.clivemaund.com, a successful resource sector website, since its inception in 2003. He has 30 years' experience in technical analysis and has worked for banks, commodity brokers and stockbrokers in the City of London. He holds a Diploma in Technical Analysis from the UK Society of Technical Analysts.
Want to read more Gold Report articles like this? Sign up for our free e-newsletter, and you'll learn when new articles have been published. To see recent articles with industry analysts and commentators, visit our Streetwise Interviews page.
Disclosure:
1) Statements and opinions expressed are the opinions of Clive Maund and not of Streetwise Reports or its officers. Clive Maund is wholly responsible for the validity of the statements. Streetwise Reports was not involved in the content preparation. Clive Maund was not paid by Streetwise Reports LLC for this article. Streetwise Reports was not paid by the author to publish or syndicate this article.
2) This article does not constitute investment advice. Each reader is encouraged to consult with his or her individual financial professional and any action a reader takes as a result of information presented here is his or her own responsibility. By opening this page, each reader accepts and agrees to Streetwise Reports' terms of use and full legal disclaimer. This article is not a solicitation for investment. Streetwise Reports does not render general or specific investment advice and the information on Streetwise Reports should not be considered a recommendation to buy or sell any security. Streetwise Reports does not endorse or recommend the business, products, services or securities of any company mentioned on Streetwise Reports.
Charts provided by the author.
© 2005-2022 http://www.MarketOracle.co.uk - The Market Oracle is a FREE Daily Financial Markets Analysis & Forecasting online publication.