


Honest Money - Gold and Silver Technical Report & Forecast
Commodities / Gold & Silver Mar 25, 2007 - 09:10 PM GMTBy: Douglas_V_Gnazzo

Gold & Silver
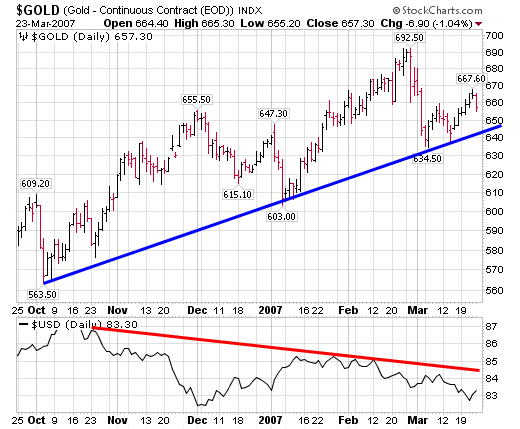
Gold closed up $3.40 to $657.30. It was the second lowest daily close of the week. The daily high for the week was put in on Thursday at $664.20. The intra-day high for the week was also on Thursday at $667.30.
The first chart up is the daily chart of gold, which shows the rising lower trend line solidly in place. Higher highs are rising from the lower left corner to the upper right hand corner of the chart. A bullish signature.
At the bottom of the chart is a comparison to the US Dollar, which is almost a mirror image (inverse) of gold.
Next up is a chart going further back in time to the 2006 May high in gold at $730.40. The chart shows the break out in November 2006 above gold's upper trend line.
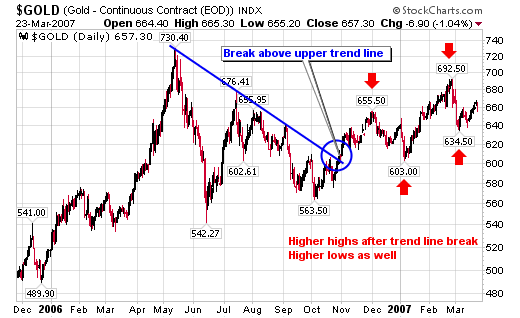
Note the two higher highs at $655.50 and $692.50; and the two higher lows at $603.00 and at $634.50. A very interesting set-up may be developing.
If the low at $634.50 holds on any pullback, gold will be in a position to move much higher towards and perhaps pass the $730.40 high. $800 is possible on the next move up if the higher low first holds as support.
Silver
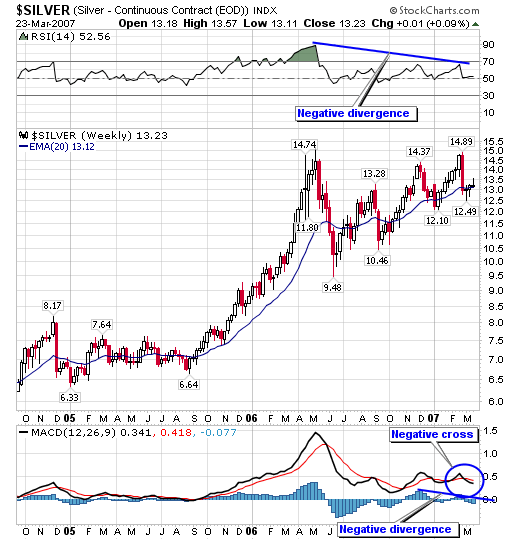
Silver closed the week out at $13.23, up 0.01 cents. The weekly close on Friday was the lowest daily close of the week. The chart shows negative divergence in the RSI indicator.
The MACD has made a negative cross, and the histograms also show negative divergence.
Next up is the daily chart of silver going back to its high in May of 2006. It shows a break above the upper trend line in October of 2006, followed by two higher highs and two higher lows.
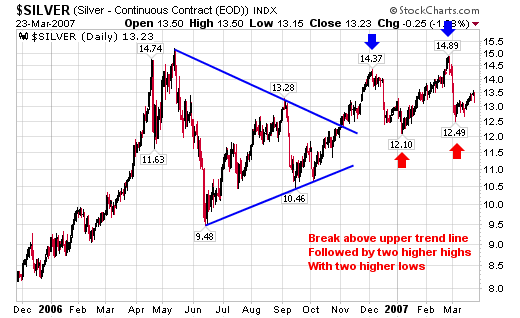
If the higher low at $12.49 holds on any pullback, silver may be setting up in the same bullish formation as gold appears to be. One caveat is the above daily chart of silver, which shows two negative divergences and one negative cross over indicator. Thus the signals are mixed.
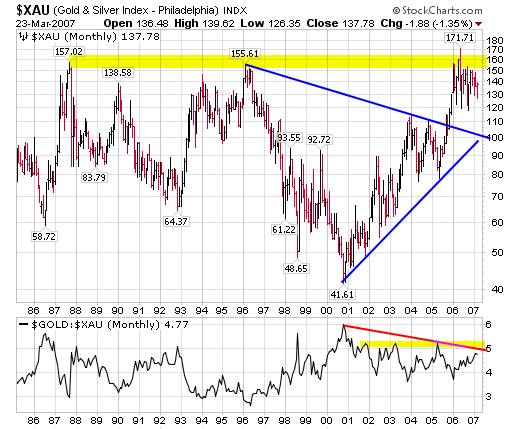
XAU Index
Below is the monthly chart of the XAU Index. The index is presently running into overhead resistance at the $150.00 level. The gold/xau ratio just recently went over the oversold level of 5, and presently sits at 4.77.
With any pullback that holds above the most recent higher low, coupled with a gold/xau ratio reading of 5 or above, will indicate a good buying entry point.
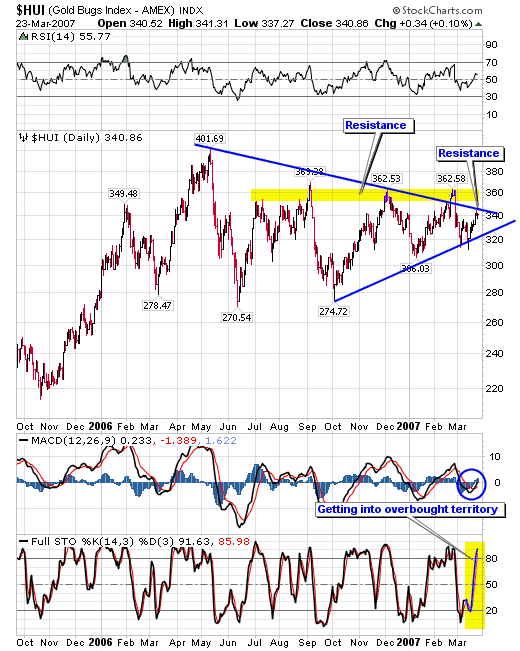
HUI Index
The HUI gained 13.85 points to close the week out at 340.86, up over 4%. It was not the daily high for the week, which occurred on Wed. at 341.83. It was, however, the highest weekly close in 4 weeks.
Up first is the daily chart of the HUI. It shows the index bumping up into overhead resistance. MACD looks like it is getting ready to make a positive cross over. The stochastic indicator shows overbought territory being approached.
If the lower trend line holds on any pullback, the index is most likely to then rally and break through resistance, which once it becomes support will lay the groundwork for the assault on the old highs.
If gold performs the way the chart formation is setting up, and the stock market does not go down in an extended move, then the HUI will rally to new highs - and soon.
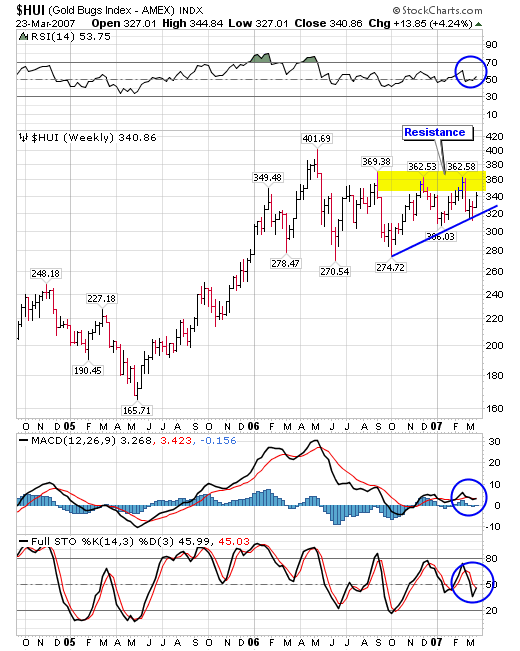
Next is the weekly chart of the HUI Index. It shows pretty much the same regarding overhead resistance and bottom trend line support.
Here, however, as opposed to the daily chart above, there are no negative divergences, and the MACD indicator is about ready to put in a positive cross over. The stochastic reading shows the market is capable of more upside action before approaching overbought levels.
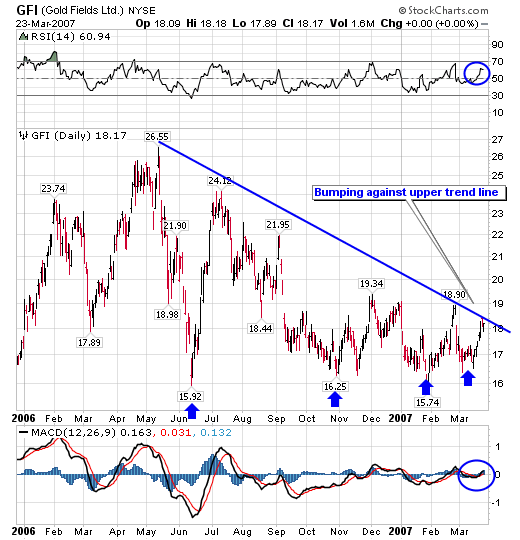
Gold Fields Ltd.
The chart below shows GFI bumping up against its upper falling trend line. When GFI breaks above its upper trend line, a powerful move should unfold over time.
A positive MACD cross is looming, RSI is headed up, and a series of higher lows have been put into place.
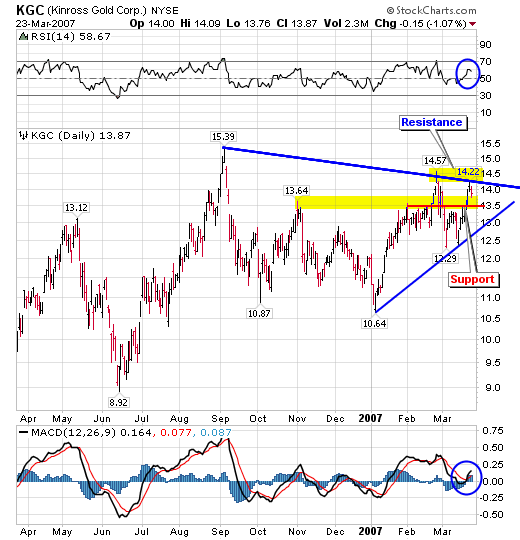
Kinross Gold
Kinross has been one of the best performers in the gold mining sector. Presently it is bumping into overhead resistance. If the upper trend line is broken through and becomes support, a powerful move up will follow.
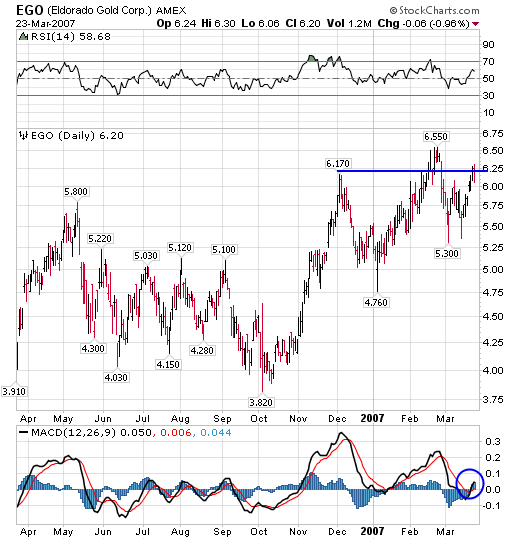
Eldorado Gold
The last chart is the daily chart of Eldorado Gold. It shows an important overhead resistance line at 6.25. Presently, EGO is sitting just below at 6.25. MACD is about to make a positive cross over.
If EGO breaks above, and stays above, its resistance line at 6.25, a strong move up will follow.
Summary
The problems in the sub-prime loan market have not fully played out. There remains more downside action to come. Several quotes were provided by officials closely connected with the sub-prime market that were concerned with the likelihood of future problems.
The stock market is priced for perfection. It does not foresee any future problems in the sub-prime market, nor in any other market for that matter. Increasing paper fiat money and credit supply around the world are fueling not only the stock market bubble, but several other asset bubbles as well.
Interest rates on the long end have started to rise. The Fed no longer has it's coveted inverted yield curve. Any interest rate surprises will be to the upside.
Oil and other commodities have started to rally. Oil is approaching overhead resistance, which if broken above and then holds as support, will indicate a trend change may be in order.
The precious metal markets had a good week. A good deal of "repair work" of working off overhead resistance/supply occurred. There is still more needed. The indicators are mixed with the weight of the evidence leaning towards a bullish resolution.
Two of the charts provided on gold and silver showed a very powerful set-up may be developing. If gold does break out the gold stocks will follow unless there is substantial downside action occurring in the overall stock market at the same time.
Several charts were provided of individual gold stocks that have been performing well, and that we are watching to add on pullbacks that hold above recent lows.
See the market indicator table below. There were no changes in the gold stock portfolio this past week.
Be careful out there. Good luck. Good trading. Good health. And that's a wrap.
Invitation
Stop by our website and check out the complete market wrap, which covers most major markets. There is also a lot of information on gold and silver, not only from an investment point of view, but also from its position as being the mandated monetary system of our Constitution - Silver and Gold Coins as in Honest Weights and Measures.
There is also a live bulletin board where you can discuss the markets with people from around the world and many other resources too numerous to list. Drop by and check it out. Good luck. Good trading. Good health. And that's a wrap.
By Douglas V. Gnazzo
Honest Money Gold & Silver Report
Douglas V. Gnazzo is the retired CEO of New England Renovation LLC, a historical restoration contractor that specialized in the restoration of older buildings and vintage historic landmarks. Mr. Gnazzo writes for numerous websites, and his work appears both here and abroad. Just recently, he was honored by being chosen as a Foundation Scholar for the Foundation of Monetary Education (FAME).
Disclaimer: The contents of this article represent the opinions of Douglas V. Gnazzo. Nothing contained herein is intended as investment advice or recommendations for specific investment decisions, and you should not rely on it as such. Douglas V. Gnazzo is not a registered investment advisor. Information and analysis above are derived from sources and using methods believed to be reliable, but Douglas. V. Gnazzo cannot accept responsibility for any trading losses you may incur as a result of your reliance on this analysis and will not be held liable for the consequence of reliance upon any opinion or statement contained herein or any omission. Individuals should consult with their broker and personal financial advisors before engaging in any trading activities. Do your own due diligence regarding personal investment decisions. This article may contain information that is confidential and/or protected by law. The purpose of this article is intended to be used as an educational discussion of the issues involved. Douglas V. Gnazzo is not a lawyer or a legal scholar. Information and analysis derived from the quoted sources are believed to be reliable and are offered in good faith. Only a highly trained and certified and registered legal professional should be regarded as an authority on the issues involved; and all those seeking such an authoritative opinion should do their own due diligence and seek out the advice of a legal professional. Lastly, Douglas V. Gnazzo believes that The United States of America is the greatest country on Earth, but that it can yet become greater. This article is written to help facilitate that greater becoming. God Bless America.
© 2005-2022 http://www.MarketOracle.co.uk - The Market Oracle is a FREE Daily Financial Markets Analysis & Forecasting online publication.