


Trading the Shadows - Oil, Dollar, Stocks, Gold Trend Analysis
Stock-Markets / Financial Markets 2018 Feb 05, 2018 - 06:14 AM GMTBy: Submissions

 B.R. HollisterI’ve spent over thirty years analyzing markets and have noticed an interesting correlation between the Wall St. Markets (stocks, interest rates) Gold (and the mining shares), the Dollar Index and Oil. In the charts below, I describe what I call “shadows” of the past and how they repeat certain patterns.
Right now I know that traders are concerned with rising interest rates, but at this point in the game I don’t think they matter too much, this is just a much needed 4-6% pull back in the stock market as we fall into the 20 week low. The problem with excessive over speculation should come home to roost especially as we come in to the latter half of the year. My read is that we may see a 20% bear market much like May-Oct 2011 or July-Oct 1998. Meanwhile, buying the dips should prove lucrative.
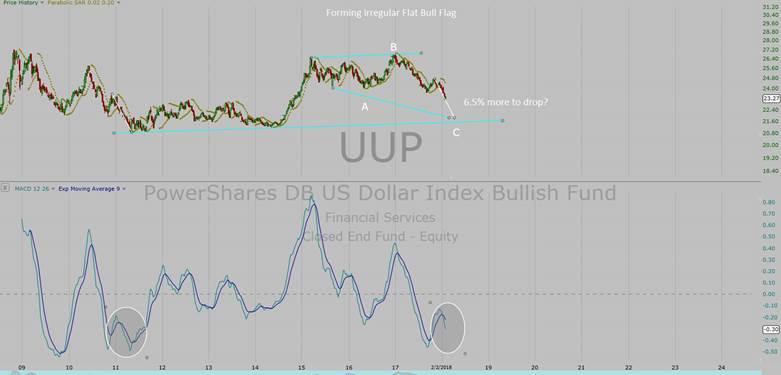
The chart below shows the 2011 shadow in the oil market. It is telling us that oil prices should peak around the third week of April, or at least hit peak momentum and moving about 15% higher. The dollar chart below that shows us that the weekly MACD is shadowing the identical move down in the dollar that brought us to the early May 2011 top (right before a 20% stock market bear). According to this theory, the dollar should bottom about 6.5% lower by around the middle of April 2018.
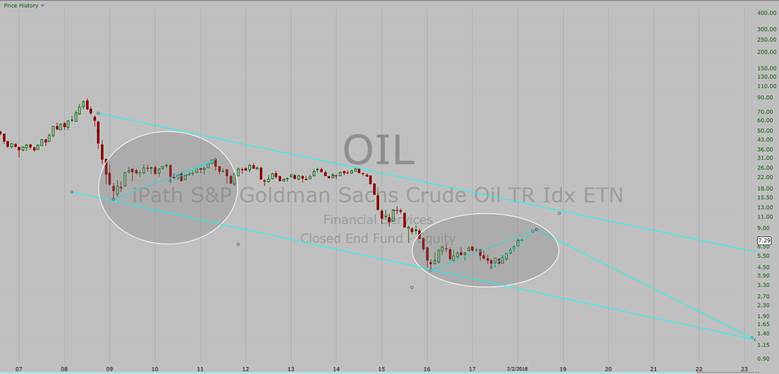
The oil chart shows that the next great shadow cycle low should occur at much lower prices into early 2023. I’m calling this the coming Depression low as it shadows a recurring 80 and 90 year cycle last seen in 1942 (WWII) and 1932 (the stock market low).
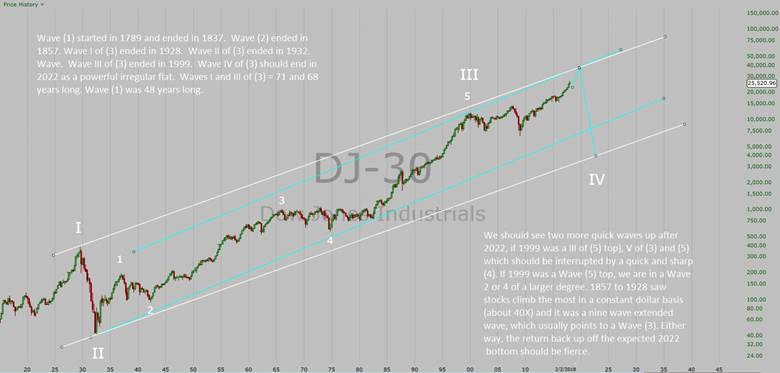
The 80 year cycle is a War cycle and the 90 year is a deflationary Depression cycle. Before that we have 1860/61 (American Civil War following the Panic of 1857) and the Depression of 1837-43. The 1772 credit crisis in London would just about mirror the Panic of 1857 (85 years apart); each were followed by a crisis war just 4 years later. The coming year 2022 cycle has both the 80 year war cycle and 90 year crash cycle coming together at once along with the larger 240-250 year revolution cycle due between 2016-26. The implications are ominous.
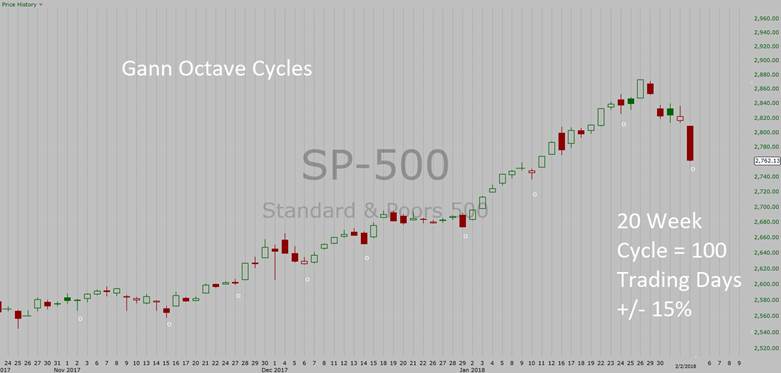
The chart below shows the S&P 500 and the Elliott Wave ABC, Strong Irregular Flat. We noted on the 26th of January that the S&P 500 was wedging and that the daily stochastics did not confirm the new high. We expected a 4 trading bottom between Jan 30-31 (wave a) and got that on FED day at 2813, a drop of almost 60 points from the top. Thursday was the ideal 4 trading top (wave b). The 8/24 TD low is due on Feb 5 (wave c). This should mark the 20 week low running 115 trading days, or 15 trading days over the average of 100 trading days. Maximum downside should hold just below 2700 on the S&P 500.
Notice the large white rising trend line. It connects the Feb 2016 low with the Nov 2016 low and August 2017 low (each low being the 40 week/9 month low). Eventually, we will have a period of distribution and a large sell-off that will break this line.
The easy money has been made and the smart money will start selling their stocks into the weaker public hands this year. The smart money is likely to buy this dip and the public will follow.
Normally, by reading the comparison of the charts of the dollar and oil between now and 2011, one might expect a 5 month bear market starting mid/late April and ending in a late Sept bottom, however, that is not what the larger cycles and the GDX miner’s index ETF may be implying. Normally, the 18/36 month cycle low would be due in Feb 2019 for the stock market but can range 15-21 months.
I believe it may come sooner according to the miner’s index ETF GDX. The GDX is telling me we could easily see a major low around early Nov (6th?) 2018, somewhat similar to the January 19, 2016 bottom. Chart support in early November on the S&P 500 is around the August 21 2017 bottom near 2417.
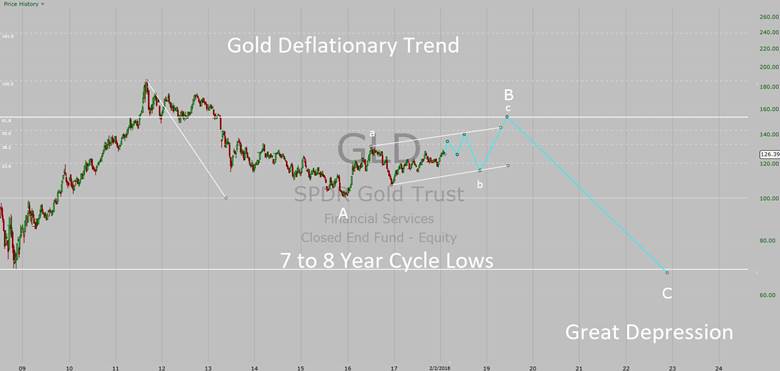
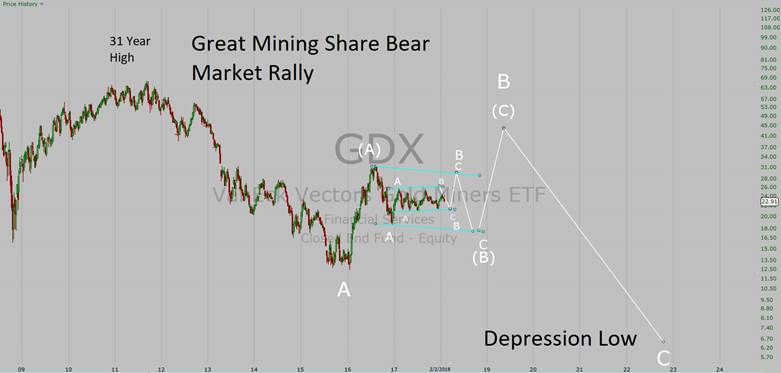
The chart below shows the weekly GDX candles. The 2011 top represented a 31 year top in a 62 year cycle (1980 + 31 = 2011). The late 2015/early 2016 bottom represented a 7-8 year cycle low in gold from the late 2008 low. The current rally seems to be a counter trend ABC rally that should retrace about 50% of the decline by 2019. Wave B should bottom in November.
Right now, gold is outperforming the mining indexes, a sign to me that all recent rallies since the July 2016 are either counter trend or hinting that gold is due for a sudden down draft.
Currently we are in a “B Wave” bull flag of an ABC rally for the mining index. Following the shadow of equal waves, we should see a bottom in mid May followed by a large rally into the end of June or early July 2018. From there a drop into early November should finish the pattern setting up for huge rally into mid 2019. The current projection is for a third week of February top above 25 on the GDX. This represents about an 11-12% rise from the Feb 5th low (cycle lows running 18 trading each). GDX could form a topping pattern into April, same as the stock market, then all of the retirement plans will have been funded leaving room for a slide into May.
There is Gann evidence of a stock market top around July/August 2018. Also, according to the McClellan Financial Publication, a top in the stock market should occur about 10 years from the oil peak on July 11, 2008, putting the summer of 2018 directly in the path of a major top. Benner’s Cycle also sees a top for 2018, but that has a variance of 2 years. A move into the 3000-3075 zone is possible this year, so this current selling is just another buying opportunity, in my opinion.
In the past, the stock market witnessed regular 20% bear markets about once every 4 years. The bear low of 1990 saw a race to the top in 2000, where a larger 50+% bear took hold into 2002/03. The same happened in 2007-09. The last 20% bear occurred in 2011 (from top to bottom it went down 20%). The normal lows used to run every 4 years. 1990-1994 (10%), 1994-1998 (21.6%) 1998-2002
(-50+%) 2002-2009 (50+%) The latter ran over 6.5 years, low to low. 2009 to 2011 ran 2.5 years and dropped 20%. Late 2018 will be 7 years from the last 20+% bear. 2018 is 16 years from the 2002 low, which is four 4-year cycles. The next one after that is due in 2022, which is a 20/40 year cycle. July-October 1998 may also be a shadow of things to come based on the 20 year cycle.
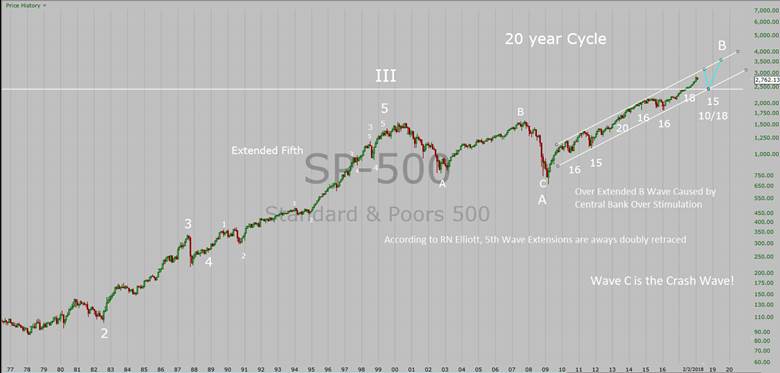
2015-16 saw a 15%+ drop and was close to four years from the late 2011 bottom. The next one due should be in the order of 15-22% with the higher side of that expected. The 2020-22 expected drop should be at least 77% if not more. The 1929-32 crash took out 89% of the value of the Dow Jones Industrials.
Bottom line and my opinion: we are late in the game in the stock market, but there is still more room to go to the upside. Pull backs should be bought now, but especially later in the year going into 2019/20. Oil and gold rallies should be considered bear rallies. Gold and silver have higher to go into 2019, but there is likely a good sized shake-out coming later this year. The dollar is in process of bottoming.
Socio-Economic Impacts: A major collapse in the stock market and world markets from 2020-2022 will likely lead to a major world conflict that will last at least 3 years. Huge money will be gained and lost in the coming years. The way we think as a society and changes in technology will become quite dramatic. Cash, being short stocks and short term t-bills will be king as the markets crash.
By B.R. Hollister
The Hollister Market Outlook studies the correlation between the Fantastic Four and the waves, cycles and other indicators to try to discern the markets. Our daily, weekly and monthly forecasts are accessed on our website. We are a private members’ only club. B.R. Hollister, a former stock broker, has been successfully trading his own account for over thirty years and brings his expertise to light for his members.
For more information: please go to our website: http://hollisteroutlook.club
© 2018 Copyright B.R. Hollister - All Rights Reserved
Disclaimer: The above is a matter of opinion provided for general information purposes only and is not intended as investment advice. Information and analysis above are derived from sources and utilising methods believed to be reliable, but we cannot accept responsibility for any losses you may incur as a result of this analysis. Individuals should consult with their personal financial advisors.
© 2005-2022 http://www.MarketOracle.co.uk - The Market Oracle is a FREE Daily Financial Markets Analysis & Forecasting online publication.