


Gold Setting Up For A Massive Upside Price Rally
Commodities / Gold and Silver 2018 Feb 25, 2018 - 04:03 PM GMTBy: Chris_Vermeulen

 Over the past few months, our research team has nailed many of the recent moves in the Metals market thanks to our advanced price modeling systems and detailed research. Recently, we’ve been watching a setup play out in Gold that has excited us. The potential for a massive upside rally that should originate as early as March 19 (only a few weeks away). The reason this is so exciting is that a breakout move in the gold market would indicate a global rush into a protective market because of fears originating from other market sectors.
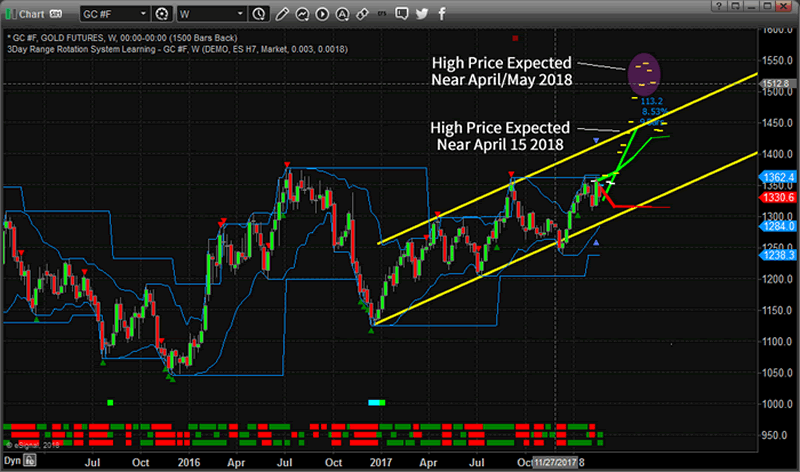
This first chart is a Weekly Gold chart highlighting our Adaptive Dynamic Learning (ADL) price modeling system. This price modeling system is capable of identifying and mapping historical price and technical patterns as well as ranking and evaluating future price moves – showing only the highest probable outcomes. This analysis is designed to teach us exactly what price should be doing based on a current price pattern. Please notice the two highlighted areas, a high price level near April 15 (near $1450) and a high price level near the end of April or early May (near $1550). Both of these moves represent massive upside legs in Gold. The first being nearly 8.5% and the second being nearly 18% advancements.
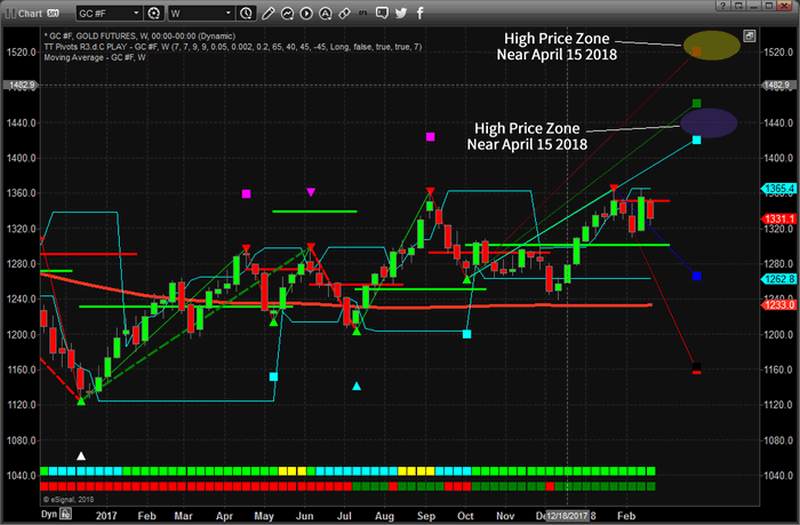
This second chart illustrates our Adaptive Fibonacci price modeling system on a Gold Weekly chart. This price modeling system tracks price rotation and uses a unique form of AI to apply Fibonacci price rotation price models showing us where price rotation is happening and what to expect in future moves. Please note the similarities in the projected future price levels in addition to the moderately tight price flag that is setting up on the right side of this chart. With higher lows and a multiple top formations near $1365, this new analysis plays perfectly with our most recent analysis.
Over the past few weeks, we alerted our members to a breakdown in price which we traded DUST inverse gold miners ETF, followed by a recent price basing/bottoming zone and breakout. We have been warning our members that the US major markets would experience weakness over from February 20 till about March 2 where a new price rally/breakout would begin. We’ve recently called a basing level in the NQ near $6500 that should happen within the next few days where support should be found before a price rally/breakout happens to create a peak near March 15. Everything we have been warning our clients about has played out almost perfectly.
Now, our price modeling systems are warning of a metals market breakout/rally originating near March 26th. Why is this so important to us and why do we believe this could be an ominous signal? The answer is simple, for the metals markets to experience this type of breakout move, some global concern must be driving a fear component and driving global investment into the metals market in a protectionist move. So, we are expecting some market event to play out near the middle of March 2018 that generates a bit of fear, resulting is a massive increase in the price of Gold and Silver. This move appears to peak near May 21~28, 2018 before weakening a bit.
We can’t stress enough that you should not worry about the overall market implications of a crisis event at this time. Our analysis of the US majors shows that the remainder of this year should continue to be relatively positive in price activity with overall higher than average price volatility after the recent surge in volatility. In other words, this crisis event appears to be an external event – not a US event.
If you want to know how you can profit from these types of move and how our research team can assist you, visit www.TheTechnicalTraders.com to learn more.
Chris Vermeulen
www.TheTechnicalTraders.com
Chris Vermeulen has been involved in the markets since 1997 and is the founder of Technical Traders Ltd. He is an internationally recognized technical analyst, trader, and is the author of the book: 7 Steps to Win With Logic
Through years of research, trading and helping individual traders around the world. He learned that many traders have great trading ideas, but they lack one thing, they struggle to execute trades in a systematic way for consistent results. Chris helps educate traders with a three-hour video course that can change your trading results for the better.
His mission is to help his clients boost their trading performance while reducing market exposure and portfolio volatility.
He is a regular speaker on HoweStreet.com, and the FinancialSurvivorNetwork radio shows. Chris was also featured on the cover of AmalgaTrader Magazine, and contributes articles to several leading financial hubs like MarketOracle.co.uk
Disclaimer: Nothing in this report should be construed as a solicitation to buy or sell any securities mentioned. Technical Traders Ltd., its owners and the author of this report are not registered broker-dealers or financial advisors. Before investing in any securities, you should consult with your financial advisor and a registered broker-dealer. Never make an investment based solely on what you read in an online or printed report, including this report, especially if the investment involves a small, thinly-traded company that isn’t well known. Technical Traders Ltd. and the author of this report has been paid by Cardiff Energy Corp. In addition, the author owns shares of Cardiff Energy Corp. and would also benefit from volume and price appreciation of its stock. The information provided here within should not be construed as a financial analysis but rather as an advertisement. The author’s views and opinions regarding the companies featured in reports are his own views and are based on information that he has researched independently and has received, which the author assumes to be reliable. Technical Traders Ltd. and the author of this report do not guarantee the accuracy, completeness, or usefulness of any content of this report, nor its fitness for any particular purpose. Lastly, the author does not guarantee that any of the companies mentioned in the reports will perform as expected, and any comparisons made to other companies may not be valid or come into effect.
Chris Vermeulen Archive |
© 2005-2022 http://www.MarketOracle.co.uk - The Market Oracle is a FREE Daily Financial Markets Analysis & Forecasting online publication.