Most Popular
1. It’s a New Macro, the Gold Market Knows It, But Dead Men Walking Do Not (yet)- Gary_Tanashian
2.Stock Market Presidential Election Cycle Seasonal Trend Analysis - Nadeem_Walayat
3. Bitcoin S&P Pattern - Nadeem_Walayat
4.Nvidia Blow Off Top - Flying High like the Phoenix too Close to the Sun - Nadeem_Walayat
4.U.S. financial market’s “Weimar phase” impact to your fiat and digital assets - Raymond_Matison
5. How to Profit from the Global Warming ClImate Change Mega Death Trend - Part1 - Nadeem_Walayat
7.Bitcoin Gravy Train Trend Forecast 2024 - - Nadeem_Walayat
8.The Bond Trade and Interest Rates - Nadeem_Walayat
9.It’s Easy to Scream Stocks Bubble! - Stephen_McBride
10.Fed’s Next Intertest Rate Move might not align with popular consensus - Richard_Mills
Last 7 days
S&P Stock Market Detailed Trend Forecast Into End 2024 - 25th Apr 24
US Presidential Election Year Equity Performance in the Presence of an Inverted Yield Curve- 25th Apr 24
Stock Market "Bullish Buzz" Reaches Highest Level in 53 Years - 25th Apr 24
Managing Your Public Image When Accused Of Allegations - 25th Apr 24
Friday Stock Market CRASH Following Israel Attack on Iranian Nuclear Facilities - 19th Apr 24
All Measures to Combat Global Warming Are Smoke and Mirrors! - 18th Apr 24
Cisco Then vs. Nvidia Now - 18th Apr 24
Is the Biden Administration Trying To Destroy the Dollar? - 18th Apr 24
S&P Stock Market Trend Forecast to Dec 2024 - 16th Apr 24
No Deposit Bonuses: Boost Your Finances - 16th Apr 24
Global Warming ClImate Change Mega Death Trend - 8th Apr 24
Gold Is Rallying Again, But Silver Could Get REALLY Interesting - 8th Apr 24
Media Elite Belittle Inflation Struggles of Ordinary Americans - 8th Apr 24
Profit from the Roaring AI 2020's Tech Stocks Economic Boom - 8th Apr 24
Stock Market Election Year Five Nights at Freddy's - 7th Apr 24
It’s a New Macro, the Gold Market Knows It, But Dead Men Walking Do Not (yet)- 7th Apr 24
AI Revolution and NVDA: Why Tough Going May Be Ahead - 7th Apr 24
Hidden cost of US homeownership just saw its biggest spike in 5 years - 7th Apr 24
What Happens To Gold Price If The Fed Doesn’t Cut Rates? - 7th Apr 24
The Fed is becoming increasingly divided on interest rates - 7th Apr 24
The Evils of Paper Money Have no End - 7th Apr 24
Stock Market Presidential Election Cycle Seasonal Trend Analysis - 3rd Apr 24
Stock Market Presidential Election Cycle Seasonal Trend - 2nd Apr 24
Dow Stock Market Annual Percent Change Analysis 2024 - 2nd Apr 24
Bitcoin S&P Pattern - 31st Mar 24
S&P Stock Market Correlating Seasonal Swings - 31st Mar 24
S&P SEASONAL ANALYSIS - 31st Mar 24
Here's a Dirty Little Secret: Federal Reserve Monetary Policy Is Still Loose - 31st Mar 24
Tandem Chairman Paul Pester on Fintech, AI, and the Future of Banking in the UK - 31st Mar 24
Stock Market Volatility (VIX) - 25th Mar 24
Stock Market Investor Sentiment - 25th Mar 24
The Federal Reserve Didn't Do Anything But It Had Plenty to Say - 25th Mar 24

Market Oracle FREE Newsletter

How to Protect your Wealth by Investing in AI Tech Stocks

Do All Bull Stocks Markets Need to Have a Bearish Divergence?

Stock-Markets / Stock Markets 2018 Mar 11, 2018 - 04:22 AM GMT

By: Troy_Bombardia

Stock-Markets

The Medium-Long Term Model states that this bull market has 1-2 years left. As a result, we are tryin to catch the bull market’s top as accurately as possible.

The January 2018 top did not have a weekly bearish divergence. Momentum (RSI 14) peaked at the same time as the S&P 500.


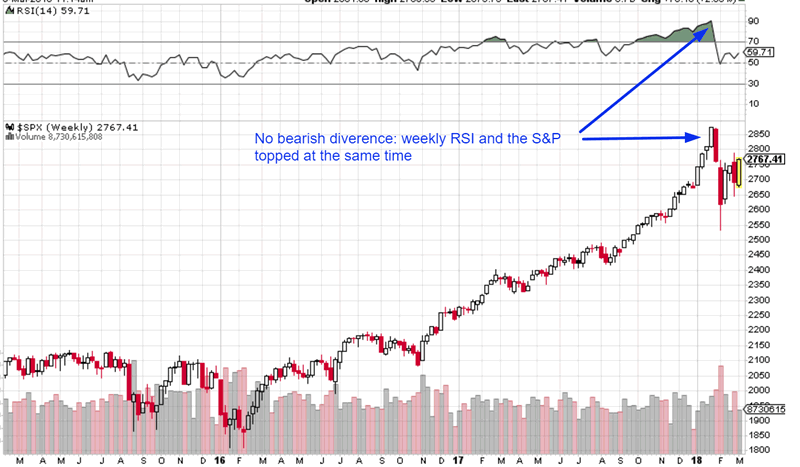
I frequently state that bull markets end AFTER momentum has weakened. This isn’t 100% true.

  1. Bull markets cannot end when momentum is EXTREMELY strong as it was in January 2018. When momentum is extremely strong, there must be a bearish divergence before the bull market can end. (See study from January)
  2. Bull markets don’t have to end with a bearish divergence (weekly bar chart). 3 historical bull market tops had bearish divergences. 1 bull market top did not have a bearish divergence.

Let’s look at the historical bull market tops in detail.

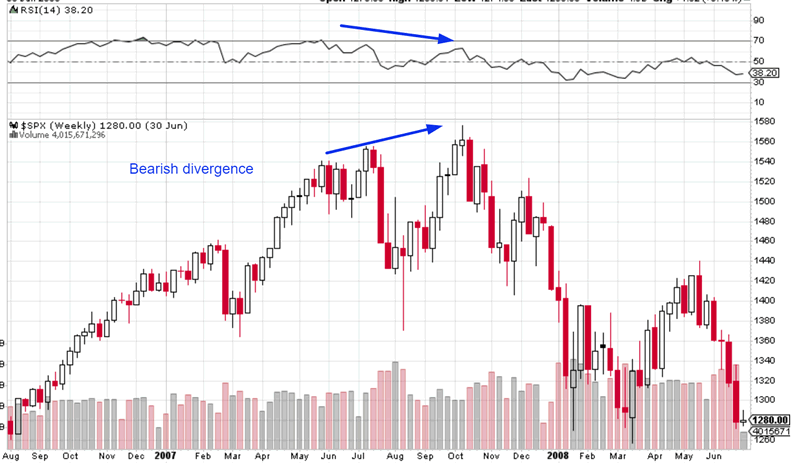
October 2007 bull market top

The S&P 500 made a bearish divergence (weekly bar chart, RSI 14) before topping in October 2007.
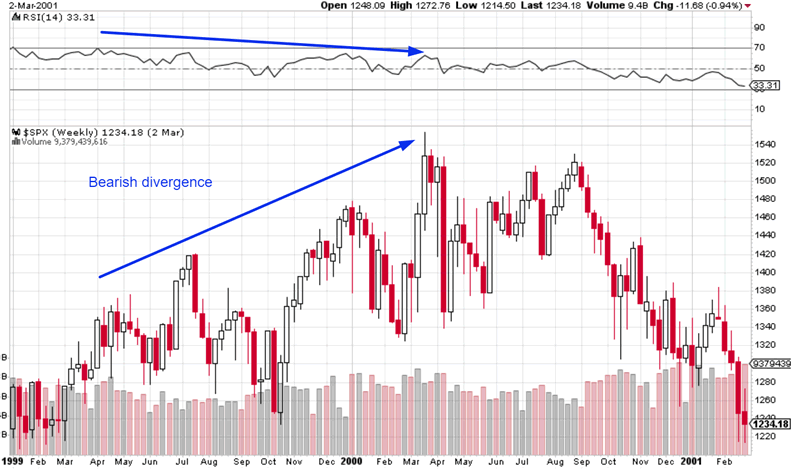
March 2000 top

The S&P 500 made a long and steady bearish divergence (weekly bar chart, RSI 14) before topping in March 2000.
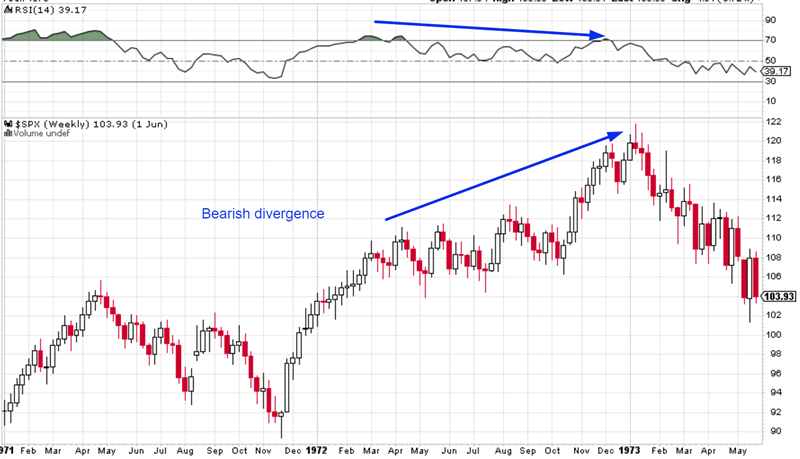
January 1973

The S&P 500 made a bearish divergence (weekly bar chart, RSI 14) before topping in January 1973.
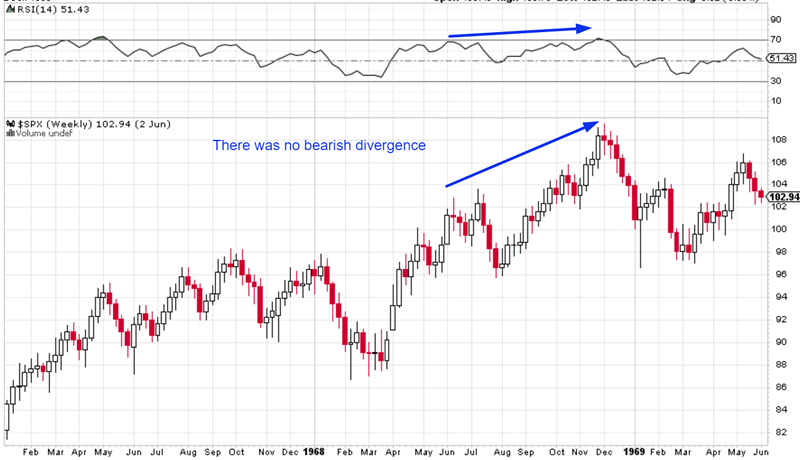
December 1968

The S&P 500 DID NOT makee a bearish divergence topping in December 1968.

Conclusion

I don’t expect the bull market’s top to be in. Most bull market tops end with a bearish divergence. We will probably see a bearish divergence when this bull market peaks because the S&P 500’s RSI was extremely high in 2018. The S&P 500 will go higher throughout 2018 in a choppy manner. A choppy uptrend = a not extremely high RSI, which means that there will be a bearish divergence.

By Troy Bombardia

BullMarkets.co

I’m Troy Bombardia, the author behind BullMarkets.co. I used to run a hedge fund, but closed it due to a major health scare. I am now enjoying life and simply investing/trading my own account. I focus on long term performance and ignore short term performance.

Copyright 2018 © Troy Bombardia - All Rights Reserved

Disclaimer: The above is a matter of opinion provided for general information purposes only and is not intended as investment advice. Information and analysis above are derived from sources and utilising methods believed to be reliable, but we cannot accept responsibility for any losses you may incur as a result of this analysis. Individuals should consult with their personal financial advisors.


© 2005-2022 http://www.MarketOracle.co.uk - The Market Oracle is a FREE Daily Financial Markets Analysis & Forecasting online publication.


Post Comment

Only logged in users are allowed to post comments. Register/ Log in