


Soccer World Cup: Will it help the Russian Stock Market?
Stock-Markets / Stock Markets 2018 Apr 06, 2018 - 03:50 PM GMTBy: Dimitri_Speck

 Dear Investor,
You may be following sporting events as passionately as you follow market price trends. Or perhaps you’re not a sports fan, and you’re only interested in the stock market?
Either way, there is an exciting question about what effect big international sporting events have on share prices. The country that hosts Olympic Games or soccer World Cup draws huge media attention, the domestic mood improves, and big investment projects are carried out. All of this can affect the stock market.
The stock market in Russia has increased
The first chart shows the price trend for the Russian stock index RTS over a one year period.
RTS Russian Stock Index, 2017–2018
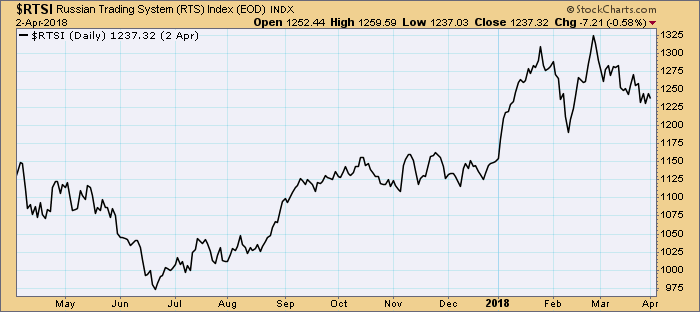
Stock exchange prices in Russia have increased strongly.
Source: Stockcharts.
As you can see, the shares in Russia – where the World Cup will begin on June 14 – have grown strongly in recent months. Is this a coincidence, or is it linked to the sporting event? To answer this question, let’s look at all of the big sporting events for which information is available.
Do international sporting events influence the markets?
Since the soccer World Cup only take place once every four years – ie, relatively rarely – we will also look at the Olympics in our investigation. This allows us to gain greater statistical significance.
Soccer World Cup tournaments and summer Olympic Games both take place every four years, with two years between each set of events. Since 1960 there have been fifteen summer Olympic games and fourteen soccer World Cup tournaments.
There have been a total of 29 sporting events, and for 21 of these with 22 countries involved, daily stock market data is available. For the purpose of standardization, and for the sake of relevance to international investors, the analysis will take place using US dollars indices where available. This list shows the countries that have been included in the event study.
List of countries included
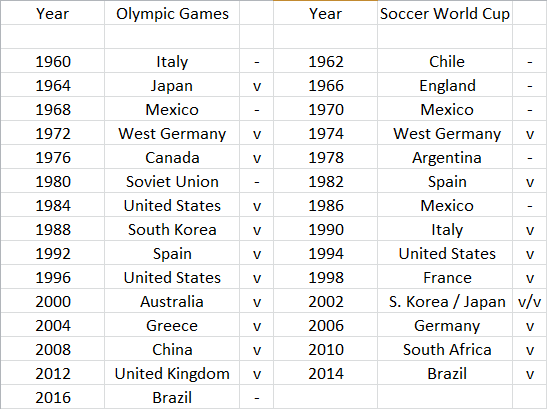
A total of 22 countries could be considered for the event study.
Source: Seasonax.
How do prices move in the year before and after a sporting event?
In order to investigate the influence of sporting events, we looked at the trend of the stock market in the respective countries around the time of the event. This gives us an anchor on which to base our investigation, as these events take place at different times of the year – between the end of May and the beginning of October.
The anchor we set was the beginning of the sporting event. The average gains will be calculated in relation to this fixed point in time. This means that we can spot, at a glance, typical price trend around large sporting events.
Event study outcomes at a glance
The following chart, therefore, does not show market trend as you are used to seeing it. Instead,
it shows the average trend of the indices of all of the countries that have been considered. If the average indices increase, the line rises accordingly.
The X axis shows information on how the average share indices rose or fell, in percentages. The Y axis shows the time before and after the beginning of the sporting event.
The beginning of the sporting event is in the middle, with a period of one year shown on either side of the event. Therefore, the chart shows a period of two years. It displays the typical trend of all share indices that have been investigated from the relevant countries at around the time at which the events took place.
Average trend of 22 national indices one year before and after the beginning of Olympic Games or World Cups
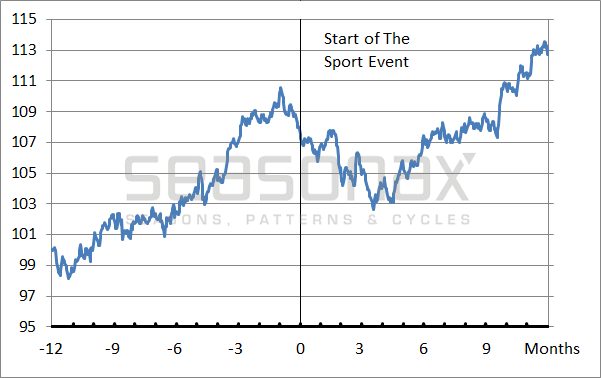
Shares typically rise in the run up to international sporting events.
Source: Seasonax.
As you can see, shares typically rise ahead of sporting events, with the rise beginning some eleven months before the first event in each competition. On average, the increase was at 12.66 per cent.
However, on average, prices start to fall again a month before the games begin. The games themselves do not boost share prices.
Why the Games have an influence
What are the reasons for this pattern? The Olympics and World Cup tournaments promote economic trend through tourism, consumption, and infrastructural measures, among other things.
For example, economists from Deutsche Bank estimated that Germany hosting the World Cup in 2006 contributed to growth by a quarter of one per cent.
In addition, there are the psychological effects. Even the weather, according to one study, influences the stock market – sport has at least as strong an effect on the mood. Furthermore, no other event draws so much international attention. So it can be seen that there actually are effects on the stock market, particularly in the run-up to an event.
The downward trend shortly before, during, and for several months after the Games is most likely a technical correction to the prior increases. As an aside, this happens more strongly around World Cup tournaments than it does around the Olympics.
Take advantage of as many different statistical anomalies as possible!
Until now, the Russian stock market followed quite closely the sporting event pattern. Given the fundamental reasons, there is an increased probability that this continues. Notwithstanding the above, there are many other statistical market anomalies you can take advantage of.To review them, either call up the Seasonax app on your Bloomberg Professional terminal by typing in “Apps Season” or via the App Studio in the menu of Thomson-Reuters Eikon. By taking advantage of many different recurring market anomalies you will boost the probability of achieving strong returns through the diversification effect, which applies not only to financial instruments as such, but also to strategies and statistical anomalies. Moreover, you should try to be among the first market participants who exploit specific anomalies – before too many people join the bandwagon and potentially cancel their effects out.
Yours sincerely,
Dimitri Speck
Founder of Seasonax and Head Analyst 90 Tage Trader
PS: With the Seasonax event tool you can create your own event studies!
© 2018 Copyright Dimitri Speck - All Rights Reserved - Disclaimer: The above is a matter of opinion provided for general information purposes only and is not intended as investment advice. Information and analysis above are derived from sources and utilising methods believed to be reliable, but we cannot accept responsibility for any losses you may incur as a result of this analysis. Individuals should consult with their personal financial advisors.
© 2005-2022 http://www.MarketOracle.co.uk - The Market Oracle is a FREE Daily Financial Markets Analysis & Forecasting online publication.