


Technical Analysis Confirms Stock Market SPX Support Level
Stock-Markets / Stock Markets 2018 May 25, 2018 - 12:32 PM GMTBy: Chris_Vermeulen

 This week presented some interesting price rotation after an early upside breakout Sunday night. The Asian markets opened up Sunday night with the ES, NQ and YM nearly 1% higher this week. This upside breakout resulted in a clear upside trend channel breakout that our researchers believe will continue to prompt higher price legs overall. Our researchers, at Technical Traders Ltd., have issued a number of research posts over the past few weeks showing our analysis and the upside potential in the markets that should take place over the next few weeks.
We expected a broad market rally this week, yet it has not materialized as we expected this week. We consider this a stalled upside base for a new price leg higher. Take a look at this Daily SPY chart to illustrate what we believe the markets are likely to do over the next few weeks. There are two downside price channels that have recently been broken by price (RED & YELLOW lines). Additionally, there is clear price support just below $272.00 that was recently breached. These upside price channel breakouts present a very clear picture that price is attempting to push higher and breakout from these price channels.
Current price rotation has tested and retested the price support level near $272.00 and we believe this recent “stalled price base” will launch a new upside price rally driving price well above the $280.00 level.
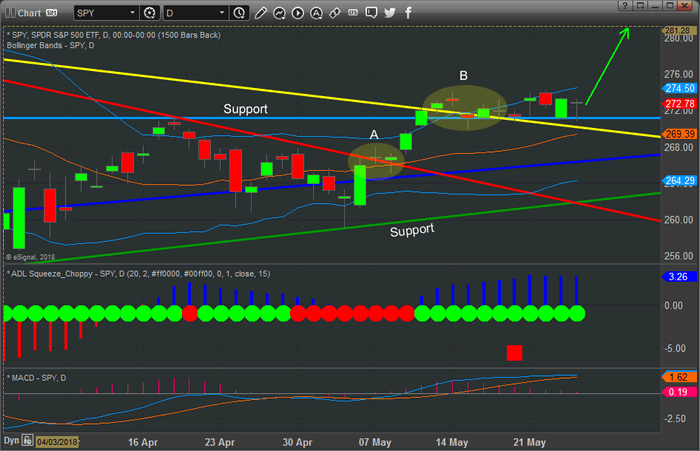
With the holiday weekend setting up in the US and the early Summer trading levels setting up, it is not uncommon for broader market moves to execute after basing/staging has executed. This current upside price action has clearly breached previous resistance channels, so we continue to believe our earlier research is correct and the US majors will mount a broad range price advance in the near future.
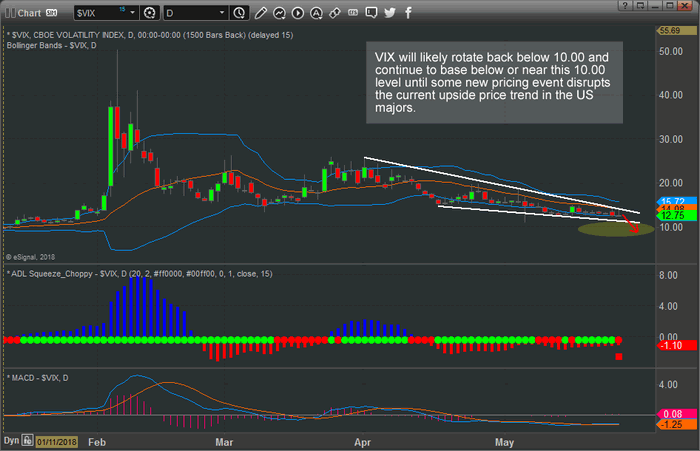
The VIX, on the other hand, appears poised to break lower – back to levels below $10 as the US major price advance executes. The VIX, as a measure of volatility that is quantified by historical price trend and volatility, should continue to fall if our price predictions are correct. If the US major markets continue to climb/rally, the VIX will likely fall to levels well below $10.00 and continue to establish a low volatility basing level – just as it did before the February 2018 price correction.
A holiday weekend, the start of lighter Summer trading and the recent upside breakout of these downward price channels leads us to believe the market will continue to push higher over time with the possibility of a massive upside “melt-up” playing out over the next 2~6+ weeks. We believe this move will drive prices to new all-time price highs for the US majors and will surprise many traders that believe the recent price rotation is a major market top formation.
Our exclusive Wealth Building Newsletter provides detailed market research, daily market video analysis, detailed trading signals and much more to assist you in developing better skills and greater success in your trading. One of our recent trade in natural gas (UGAZ) is already up over 26% and we believe it will run another 25-50% higher from here! We provide incredible opportunities for our member’s success. We urge you to visit www.TheTechnicalTraders.com to learn how we can assist you in finding new success.
Our 53 years experience in researching and trading makes analyzing the complex and ever-changing financial markets a natural process. We have a simple and highly effective way to provide our customers with the most convenient, accurate, and timely market forecasts available today. Our stock and ETF trading alerts are readily available through our exclusive membership service via email and SMS text. Our newsletter, Technical Trading Mastery book, and 3 Hour Trading Video Course are designed for both traders and investors. Also, some of our strategies have been fully automated for the ultimate trading experience.
Chris Vermeulen
www.TheTechnicalTraders.com
Chris Vermeulen has been involved in the markets since 1997 and is the founder of Technical Traders Ltd. He is an internationally recognized technical analyst, trader, and is the author of the book: 7 Steps to Win With Logic
Through years of research, trading and helping individual traders around the world. He learned that many traders have great trading ideas, but they lack one thing, they struggle to execute trades in a systematic way for consistent results. Chris helps educate traders with a three-hour video course that can change your trading results for the better.
His mission is to help his clients boost their trading performance while reducing market exposure and portfolio volatility.
He is a regular speaker on HoweStreet.com, and the FinancialSurvivorNetwork radio shows. Chris was also featured on the cover of AmalgaTrader Magazine, and contributes articles to several leading financial hubs like MarketOracle.co.uk
Disclaimer: Nothing in this report should be construed as a solicitation to buy or sell any securities mentioned. Technical Traders Ltd., its owners and the author of this report are not registered broker-dealers or financial advisors. Before investing in any securities, you should consult with your financial advisor and a registered broker-dealer. Never make an investment based solely on what you read in an online or printed report, including this report, especially if the investment involves a small, thinly-traded company that isn’t well known. Technical Traders Ltd. and the author of this report has been paid by Cardiff Energy Corp. In addition, the author owns shares of Cardiff Energy Corp. and would also benefit from volume and price appreciation of its stock. The information provided here within should not be construed as a financial analysis but rather as an advertisement. The author’s views and opinions regarding the companies featured in reports are his own views and are based on information that he has researched independently and has received, which the author assumes to be reliable. Technical Traders Ltd. and the author of this report do not guarantee the accuracy, completeness, or usefulness of any content of this report, nor its fitness for any particular purpose. Lastly, the author does not guarantee that any of the companies mentioned in the reports will perform as expected, and any comparisons made to other companies may not be valid or come into effect.
Chris Vermeulen Archive |
© 2005-2022 http://www.MarketOracle.co.uk - The Market Oracle is a FREE Daily Financial Markets Analysis & Forecasting online publication.