


Phantom Blips On The Stock Market Chart – Don’t Lose Focus - Free Silver!
Stock-Markets / Stock Markets 2018 May 31, 2018 - 04:15 PM GMTBy: Chris_Vermeulen

 Recent news seems to have everyone concerned about Italy, global debts, Europe and the potential for a debt contagion exploding into the markets. Yet, our research into price activity says this market is just getting started with an upside swing that could be massive. Take a few minutes to review our current research to see why we believe the extended level of fear in the markets is related to the recent February price rotation and a generally accepted erroneous Elliot Wave Count.
We, the research team at Technical Traders Ltd., pride ourselves at sticking to our proprietary research and waiting for price to tell us if our analysis is correct or not. Because of this, our research can sometimes directly opposite to the other analysts out there. The tricky part of trying to predict the future is that we won’t know if we are correct until the market does what it does in the future. Still, we believe that price is critical to understanding the markets dynamics at play as well as a core understanding of economic fundamentals as related to capital, debt, expectations and degrees of risk. Keeping this in mind, let’s get to the charts to show you what we are seeing in the markets right now.
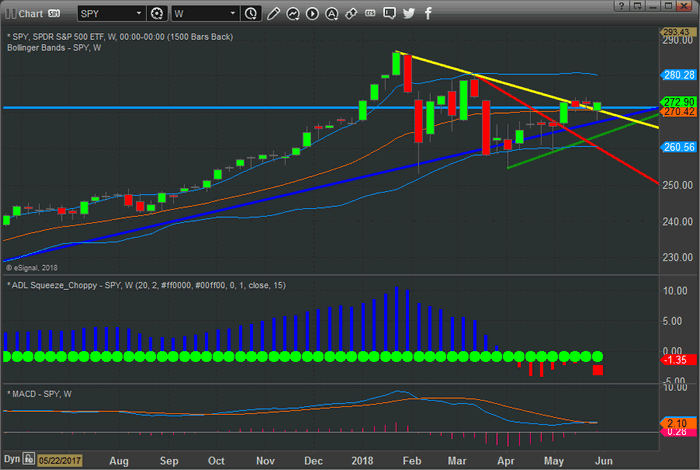
This Weekly SPY chart clearly shows the recent upside price breakout of the RED and YELLOW price downtrend ranges. Additionally, even though Italy sent shock waves through the markets yesterday, the price recovery today pushed the closing price to well above the key support level near $270. Pay close attention to the GREEN upward price sloping line near recent lows. Unless this level if breached/broken, there is no reason for great concern of any downside price move.
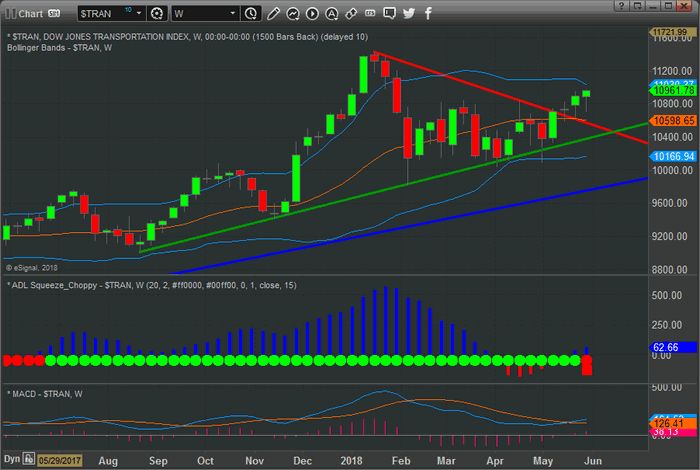
This next chart, the Weekly TRAN (Transportation Index), paints an even clearer picture of the recent price advance. Weekly, the price lows since the February market lows, have been advancing to higher and higher levels. The most recent unique low, near $10,100, is the current Fibonacci Key Price Low and as long as the current price does not rotate lower to test that level, we have nothing to worry about in terms of downside price activity. Yes, price rotation could continue within this range ($10,000 to $11,000), but that unique low price is the key to the support that is holding the markets together and driving price higher.
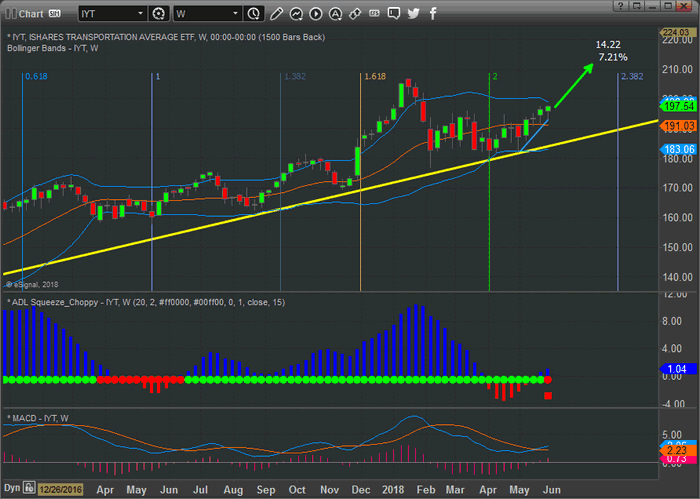
This last chart is a Weekly IYT ETF. It is very similar to the Transportation Index chart, but still shows a very clear upward sloping price channel and a more recent upward sloping price advance near the right side of this chart. Pay attention to the MACD levels on each of these charts. In each instance the MACD has rotated into a bullish indication with the potential for an even greater price advance setting up.
In our opinion, the concern in the market regarding global debt is warranted. We will post a more detailed research report on this issue in the near future for all our followers. Yet we believe the fundamentals of the US market is strong and we believe the “completed wave 5 Elliot Wave” analysis that is being proposed by many analysts is erroneous. We issued our research on this issue a little over a week ago and we are waiting to see if price breaks to new all-time highs to confirm our analysis.
Please don’t get caught off-guard with regards to this price rotation and what it means to the markets. A massive price expansion pattern is setting up in the US markets that may drive prices much higher all the way through 2019 and possibly further. We believe many of the major analysts have missed this pattern and we have positioned our loyal members to take advantage of this move in the future.
Visit www.TheTechnicalTraders.com to learn how we can help you stay ahead of this market and stay on the right side of price trends. You owe it to yourself to learn how we can deliver superior research and trading signals to help you find profits and better manage your trades.
BONUS FREE SILVER ROUNDS!
– Anyone who joins the 2-Year Wealth Building plan during May 30 and 31 will get one of my new 1oz silver rounds mailed to them!
Limited Time Offer May 30 & 31 Only – Join Now!
Chris Vermeulen
www.TheTechnicalTraders.com
Chris Vermeulen has been involved in the markets since 1997 and is the founder of Technical Traders Ltd. He is an internationally recognized technical analyst, trader, and is the author of the book: 7 Steps to Win With Logic
Through years of research, trading and helping individual traders around the world. He learned that many traders have great trading ideas, but they lack one thing, they struggle to execute trades in a systematic way for consistent results. Chris helps educate traders with a three-hour video course that can change your trading results for the better.
His mission is to help his clients boost their trading performance while reducing market exposure and portfolio volatility.
He is a regular speaker on HoweStreet.com, and the FinancialSurvivorNetwork radio shows. Chris was also featured on the cover of AmalgaTrader Magazine, and contributes articles to several leading financial hubs like MarketOracle.co.uk
Disclaimer: Nothing in this report should be construed as a solicitation to buy or sell any securities mentioned. Technical Traders Ltd., its owners and the author of this report are not registered broker-dealers or financial advisors. Before investing in any securities, you should consult with your financial advisor and a registered broker-dealer. Never make an investment based solely on what you read in an online or printed report, including this report, especially if the investment involves a small, thinly-traded company that isn’t well known. Technical Traders Ltd. and the author of this report has been paid by Cardiff Energy Corp. In addition, the author owns shares of Cardiff Energy Corp. and would also benefit from volume and price appreciation of its stock. The information provided here within should not be construed as a financial analysis but rather as an advertisement. The author’s views and opinions regarding the companies featured in reports are his own views and are based on information that he has researched independently and has received, which the author assumes to be reliable. Technical Traders Ltd. and the author of this report do not guarantee the accuracy, completeness, or usefulness of any content of this report, nor its fitness for any particular purpose. Lastly, the author does not guarantee that any of the companies mentioned in the reports will perform as expected, and any comparisons made to other companies may not be valid or come into effect.
Chris Vermeulen Archive |
© 2005-2022 http://www.MarketOracle.co.uk - The Market Oracle is a FREE Daily Financial Markets Analysis & Forecasting online publication.