


A Better Yield Curve for Predicting the Stock Market is Bullish
Stock-Markets / Stock Markets 2018 Jul 18, 2018 - 07:03 AM GMTBy: Troy_Bombardia

 The Treasury yield curve is flattening, which has some investors and traders turning bearish. Most people focus on the 10 year – 2 year yield curve, which is close to inverting.
*Investors and traders only need to be careful once the yield curve inverts. A flattening yield curve on its own means nothing until it becomes inverted.
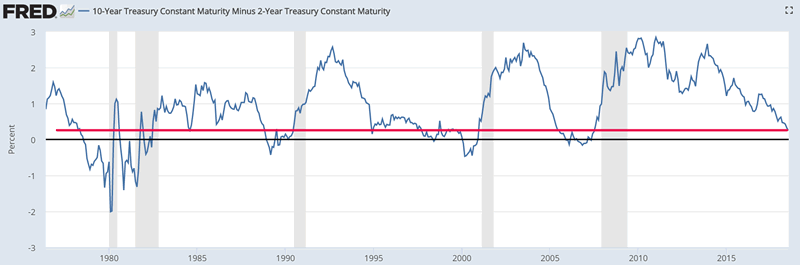
As you can see, the 10 year – 2 year yield curve is close to being inverted. It currently stands at 0.24%
HOWEVER, the 10 year – 2 year yield curve isn’t the best yield curve. The 10 year – 2 year yield curve tends to become inverted too early, which means that it becomes bearish too early.
The 10 year – 3 month yield curve is a better yield curve because it tends to invert later. When it inverts, it gives you a more timely SELL signal. The 2 year Treasury yield tends to be higher than the 3 month Treasury yield.
The 10 year – 3 month yield curve is still far from being inverted. It currently stands at 0.9%.
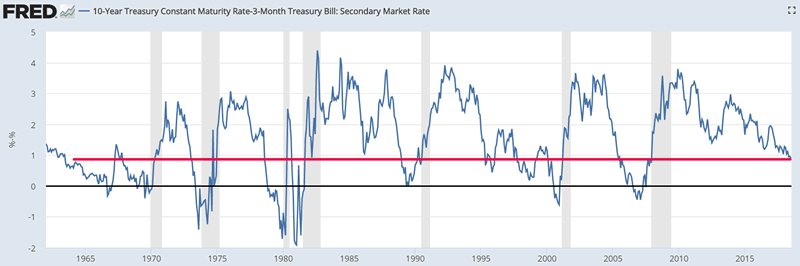
When the 10 year – 3 month yield curve falls to 0.9% for the first time in an economic expansion cycle, the stock market usually continues to go up.
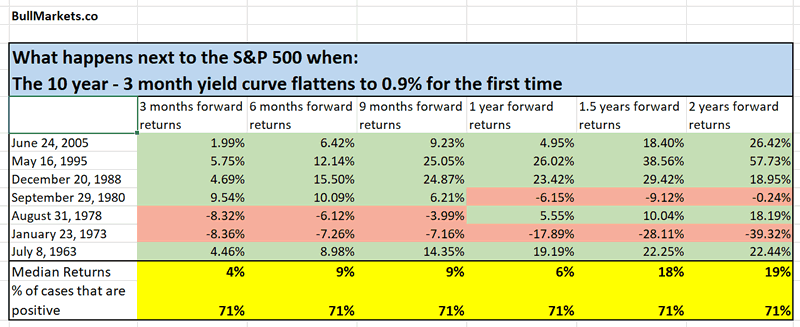
Click here to download the data in Excel.
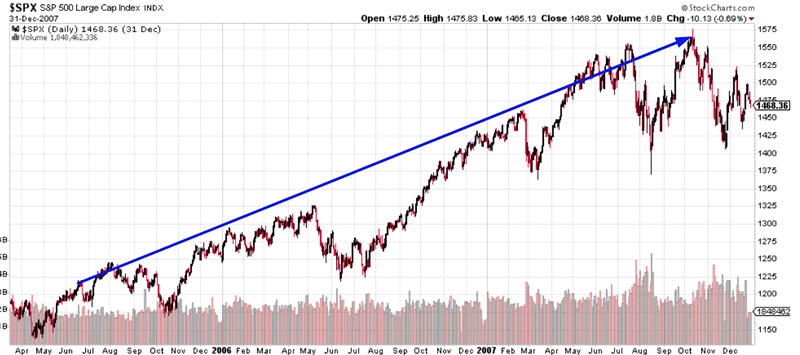
June 24, 2005
The stock market rallied for 2 more years before topping in 2007, even though there were multiple “small corrections” along the way.
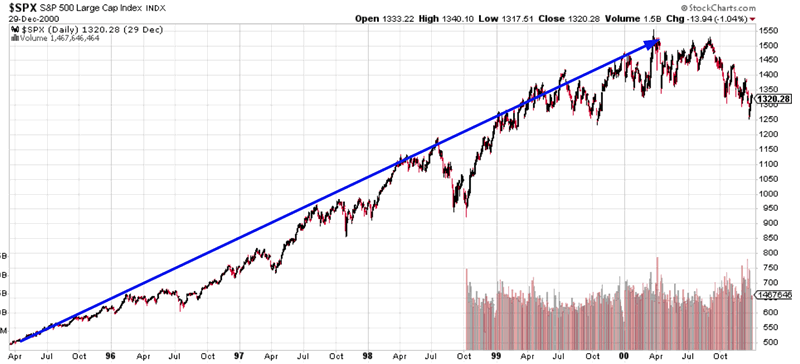
May 16, 1995
The stock market went up over the next 5 years before topping in 2000. There was a “big correction” and multiple “small corrections” along the way.
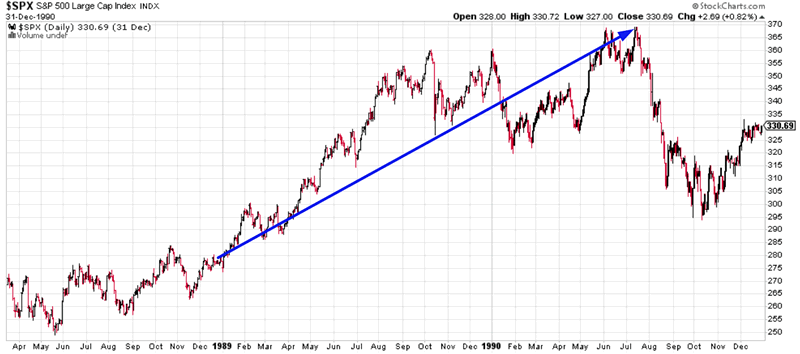
December 20, 1988
The stock market rallied for another 1.5 years before starting a “big correction”, which the Medium-Long Term Model predicted.
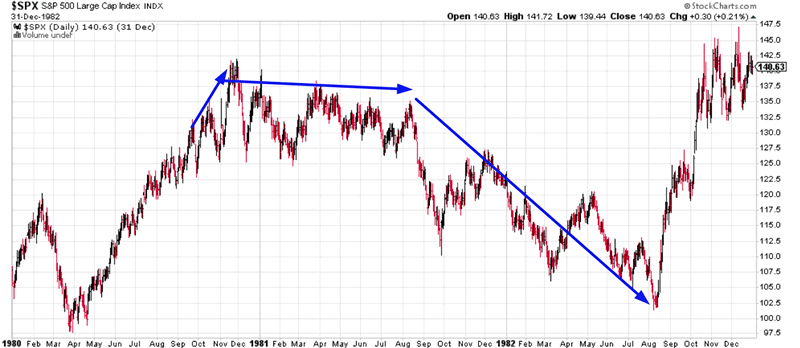
September 29, 1980
The stock market rallied for another 2 months. Then it swung sideways for the next half year before starting a “big correction”.
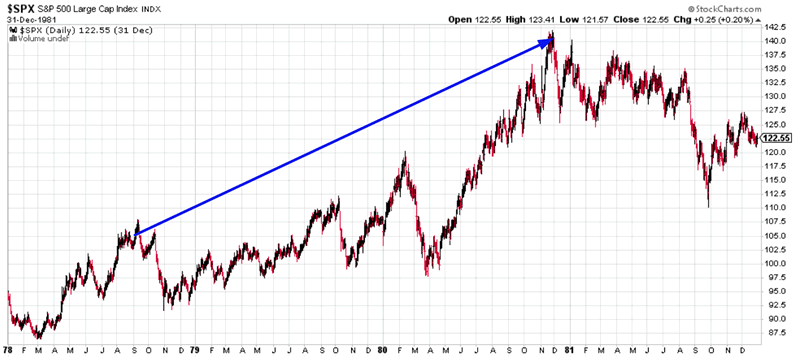
August 31, 1978
The stock market rallied for the next 2 years, even though there were multiple “small corrections” and a “big correction” along the way.
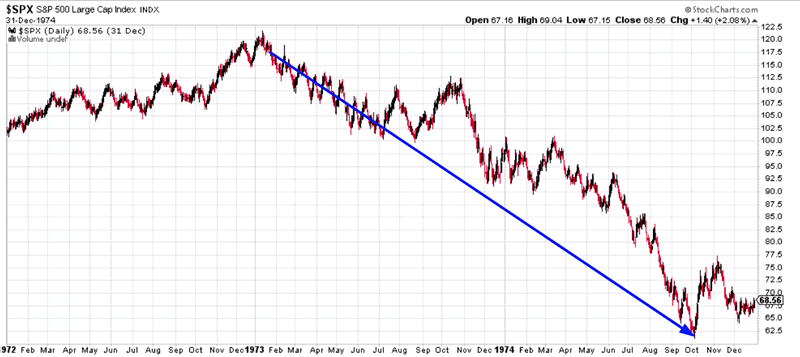
January 23, 1973
The stock market started a bear market when the 10 year – 3 month yield curve flattened to 0.9%
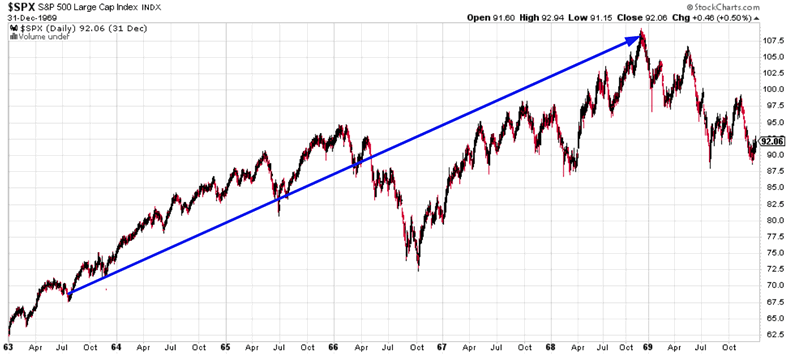
July 8, 1963
The stock market rallied for 5.5 more years before a bear market. There was a “big correction” and multiple “small corrections” along the way.
Conclusion
The 10 year – 3 month yield curve is a better yield curve. Based on where it is today, the stock market will probably continue to rally in the medium-long term.
There is only 1 bearish case out of these 7 historical cases. That was due to OPEC’s oil embargo. Unless Trump’s trade war results in a global catastrophe and recession, that bearish case is unlikely to play out today.
Trump’s trade war with China is expected to shave less than -0.2% off of U.S. GDP growth. With the U.S. economy growing at 3-4% a year, this trade war will not have a big impact on the economy.
Click here for more market studies
By Troy Bombardia
I’m Troy Bombardia, the author behind BullMarkets.co. I used to run a hedge fund, but closed it due to a major health scare. I am now enjoying life and simply investing/trading my own account. I focus on long term performance and ignore short term performance.
Copyright 2018 © Troy Bombardia - All Rights Reserved
Disclaimer: The above is a matter of opinion provided for general information purposes only and is not intended as investment advice. Information and analysis above are derived from sources and utilising methods believed to be reliable, but we cannot accept responsibility for any losses you may incur as a result of this analysis. Individuals should consult with their personal financial advisors.
© 2005-2022 http://www.MarketOracle.co.uk - The Market Oracle is a FREE Daily Financial Markets Analysis & Forecasting online publication.