


Stocks: When "Sentiment is Strikingly Suited" for a Major Stock Market Event
Stock-Markets / Stock Markets 2018 Jul 25, 2018 - 02:08 PM GMTBy: EWI

What an extreme use of leverage tells you about the trend
Stock market history shows that when the Elliott wave model of stock market patterns and market bullish/bearish sentiment indicators are aligned, you have the basis for a high-confidence forecast.
That was the exact situation back in January, right before the stock market's jarring sell-off, from which stocks still haven't quite recovered.
Let's start with a brief review of Elliott Wave International's analysis of the DJIA's Elliott wave chart pattern. On Jan. 5, the Elliott Wave Financial Forecast noted:
The wave structure of the advance looks mature ....
Mature, as in -- we could clearly see a 5-wave price pattern on DJIA charts. When a fifth wave ends, a move in the opposite direction begins.
Indeed, just three weeks later, the DJIA hit a peak of 26,617. As you'll recall, a period of wild volatility shortly followed.
Jump on once-in-a-lifetime opportunities and avoid dangerous pitfalls that no one else sees coming. We can help you prepare for opportunities and side step risks that will surprise most investors. You can get deeper insights in Elliott Wave International's new free report: 5 "Tells" that the Markets Are About to Reverse. The insights that you'll gain are especially applicable to the price patterns of key financial markets, including the stock market, now. Read the free report now.
What also helped the Elliott Wave Financial Forecast make the call was the extreme bullish reading in the stock market's sentiment measures, which supported the view that the DJIA's "advance looks mature":
Sentiment is strikingly suited for the end of an advance.
Realize that sentiment is "suited for the end of an advance" when it reaches an extreme bullish reading. In a nutshell, when everyone is bullish, everyone has already bought, so the price cannot move any higher. The opposite is true at the end of a prolonged downturn.
Now, let's proceed with the details of key sentiment measures from around the start of 2018.
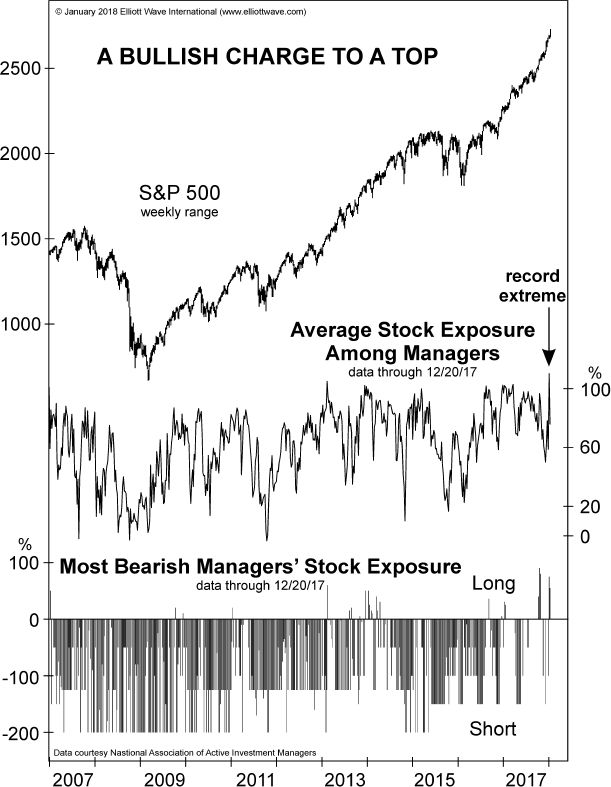
This chart and commentary is also from the January Financial Forecast (Elliott wave labels available to subscribers):
The chart shows the National Association of Active Investment Managers' Equity Exposure index. NAAIM's index hit a record high of 109.4 the week of December 11. Since 100 equates to a 100% invested position, this means that NAAIM portfolios were leveraged long to a record degree. As noted above, the extreme use of leverage represents a heightened state of expectation, as it means that buyers of stock are so confident in an advance that they are willing to borrow money to bet on rising share prices. [Emphasis added.]
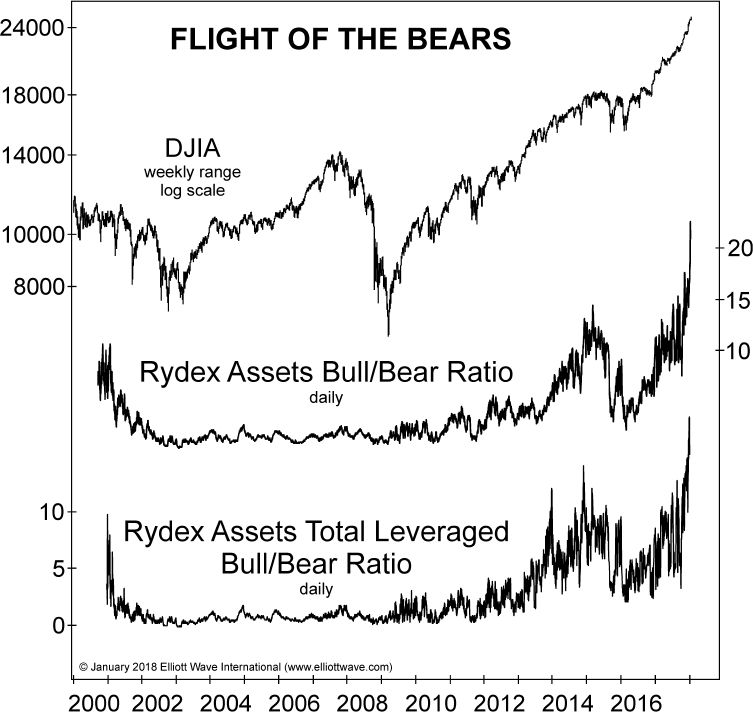
Another January Financial Forecast chart with accompanying commentary sheds more light on the prevailing sentiment just before the DJIA's January 26 peak:
Last month we showed a chart of the Rydex Total Leveraged Bull/Bear Ratio through November. With leveraged-long Rydex assets more than 14.4 times as great as leveraged-short assets, the ratio tied the prior record extreme registered in late 2014. In December, the ratio shattered that record with a surge to 18.6, a boost of 29% from the November high, as shown by the lower graph on the chart. The middle line on the graph shows an even more breathtaking spike in Rydex's Bull/Bear Ratio (unleveraged). The ratio jumped to 22 on December 29, easily the most extreme reading in the 16-year history of the data. [Emphaisis added.]
So, as you might imagine, our Elliott Wave Financial Forecast editors were not surprised by the DJIA's peak (26,617) just three weeks later.
Regarding the details of EWI's technical analysis at the time, we encourage you to see them for yourself in a new free report that remains relevant now (see below).
The January setup will repeat itself, and having the knowledge of what to look for can help you avoid getting caught unprepared -- as well as capturing opportunities that every market reversal presents.
Read the free report now -- just look for the quick-access details below.
Learn how to spot once-in-a-lifetime opportunities and avoid dangerous pitfalls that no one else sees coming
We can help you learn how to spot opportunities and side step risks that will surprise most investors.
You can get deeper insights in Elliott Wave International's new free report: 5 "Tells" that the Markets Are About to Reverse.
The insights that you'll gain are especially applicable to the price patterns of key financial markets, including the stock market, now.
This article was syndicated by Elliott Wave International and was originally published under the headline Stocks: When "Sentiment is Strikingly Suited" for a Major Stock Market Event. EWI is the world's largest market forecasting firm. Its staff of full-time analysts led by Chartered Market Technician Robert Prechter provides 24-hour-a-day market analysis to institutional and private investors around the world.
© 2005-2022 http://www.MarketOracle.co.uk - The Market Oracle is a FREE Daily Financial Markets Analysis & Forecasting online publication.