


Combining Andrews and Elliott Wave to find the Third Wave
Stock-Markets / Stock Markets 2018 Aug 24, 2018 - 03:00 PM GMTBy: Ron_Jaenisch

 Over the years the question of whether the Andrews lines and rules can be used in conjunction with Elliott wave to locate the popular third wave has come up several times. Third waves are popular with Elliott wavers because they often result in long and strong moves. In this article you will see that it is possible and that using the earlier - 1970 era Andrews rules (verses the stuff on the web) makes it much easier. We will examine the two stock trades that were written about, before the orders were placed, in the Andrews Email group this year.
The last trade was TYL. The step by step procedure was pretty easy. First the top was verified with the New Major Andrews Pivot Indicator (MAPI).
Then as you can see on the chart price went down and zoomed past the Median Line. After the down move price went up in what many Elliott wave enthusiasts may call an ABC. During the ABC and the C wave, Advanced Andrews students would probably note that a shakeout pattern has formed. Price went beyond the down sloping median line parallel that is drawn. Note that price also did not make it up past the smaller median line, at the area marked with a C.
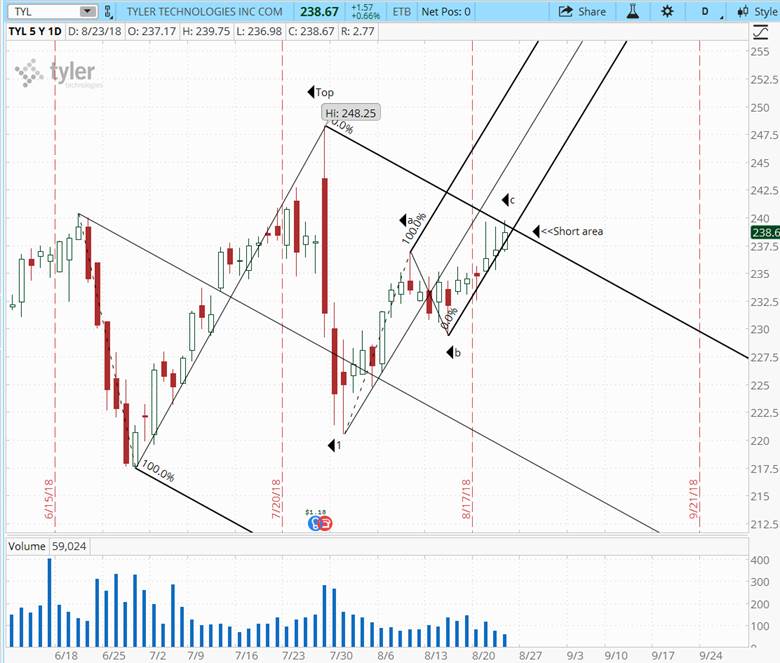
This article was written on August 23, 2018 and what occurred thereafter will be something you can see in your charts. With this stock, rather than go short outright put options were purchased. This is due to the fact that the major indices had that possibility of reversing at the slightly higher, MAPI in the near future. Going higher and making a top could easily influence most widely followed stocks and TYL could still go a bit higher. This would give us the opportunity to get more very cheap put options. It is during the month of September that stocks typically have the strongest decline.
A trade that was completed earlier in the year was with Maxwell. Once again after noting that the top was verified by MAPI the median line was drawn and it was noted that on the way to the pivot marked #1 prices zoomed past the Median Line.
As can be clearly seen on the chart, thereafter price reversed back up and made an ABC correction which went past the upper median line parallel. This was the short area. There after price went down to the lower median line parallel where profits were taken.
-
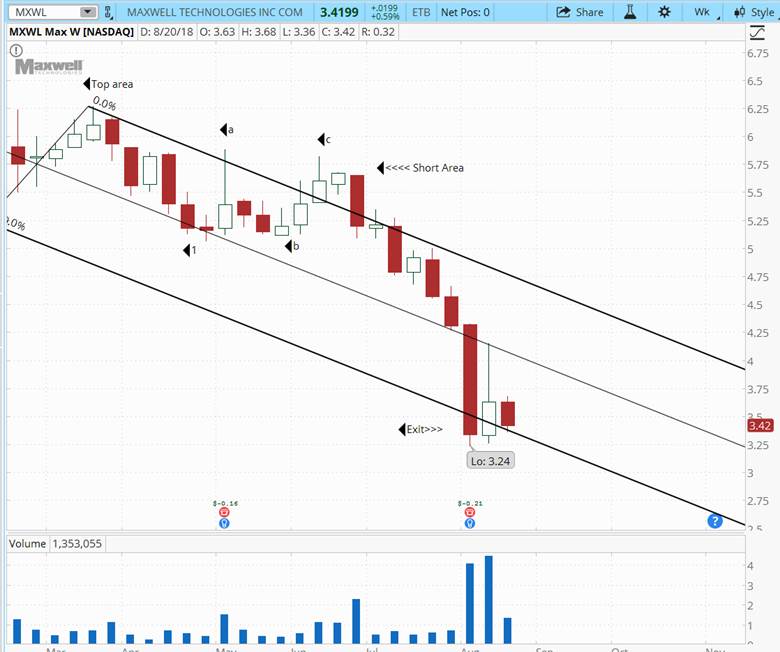
As can be seen in the Maxwell chart below, price did not make it up to the Median Line. Andrews taught that
when this occurs price makes that up in the next move ( which would be down ) Advanced Andrews students would notice that price also formed a shakeout pattern prior to the down move.
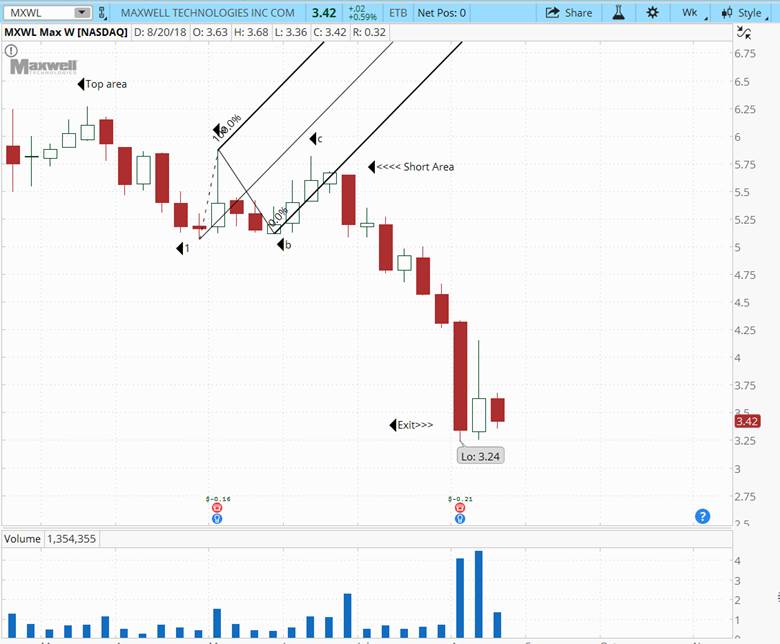
Standard Elliott wave theory would suggest that another thrust wave down is likely in this case, since it is obviously not a correction pattern. Price at this point could go sideways for weeks before doing going down further. Andrews techniques found that there were several lines coming together near the lows and waiting for further decline was probably not worth it.
When using Andrews techniques, my mentor professor Alan Andrews would always say “When you do your analysis of a chart you start atthe left of the page, not on the right.” This is due to the fact that a series of events occur prior to a long and strong move that puts a lot of $$$ into your pockets.
By Ron Jaenisch
Copyright 2018 © Ron Jaenisch - All Rights Reserved
Disclaimer: The above is a matter of opinion provided for general information purposes only and is not intended as investment advice. Information and analysis above are derived from sources and utilising methods believed to be reliable, but we cannot accept responsibility for any losses you may incur as a result of this analysis. Individuals should consult with their personal financial advisors.
© 2005-2022 http://www.MarketOracle.co.uk - The Market Oracle is a FREE Daily Financial Markets Analysis & Forecasting online publication.