


Gold Price Analysis: 3 Ideas Make Tough Trading
Commodities / Gold and Silver 2018 Sep 04, 2018 - 03:09 PM GMT
 If you have been following Gold over the last few years you are probably frustrated like most Gold bulls are, essentially Gold and Gold stocks have gone nowhere for the past two years, although you could argue that the many Gold stocks have a downwards bias the past two years, but Gold is still above the Dec 2016 lows.
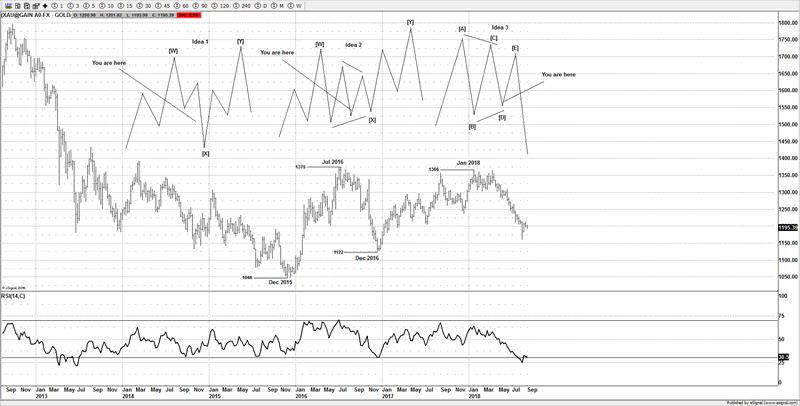
There are a number of patterns that I am currently watching and no one idea has a strong foothold, although if any upside fails to move above $1340, then it will make a better case for Idea 3 and a large triangle has been in progress over the last 2 years.
Both the Ideas 2 & 3 can still argue for some variation of a triangle and a rally towards $1300 – 1320. If however the market continues to move below $1122 (Dec 2016 low), then Idea 1 will be favored and a large 3 wave decline from $1375 is developing for a [X] wave. The lower it moves the more bullish I am based on the idea of at least a rally towards $1300 – 1320 or higher, as the more bearish idea (Idea 3) would still favor a move towards $1300 - 1320 to end the triangle idea.
Corrective patterns are notoriously difficult to predict, let alone trade, as they have a habit of morphing, but a skilled Elliottician can put into context the price action and present some ideas that can help investors and traders make better decisions. It would need a large breakdown under $1060 to consider a possible breakdown is in development, but as it stands I still like the idea of a rally, even if the market moves below $1122 before a move higher starts. If $1160 marks a short term low point, for one of the triangle ideas (Idea 2 or Idea 3). Then a rally towards $1300 – 1320 would be favored over the following weeks.
Technically as long as price remains above $1122 either of the triangle options remain valid, only a break of $1122 (Dec 2016 low) would suggest we consider Idea 1 and look for low around $1100 - 1120 to setup for a rally back above $1375 (Jul 2016 high).
The last idea (not shown) is that a large 3 wave rally from $1046 truncated at $1366 (Jan 2018 high) and the market is about to break down below $1046 (Dec 2015 low). Whilst it’s not one of my favored ideas, it’s not something I can totally rule out as the bigger picture ideas still eventually point to a move back below $1046 to end the decline from $1920.
Until next time,
Have a profitable week ahead.
Click here to become a member
You can also follow us on twitter
What do we offer?
Short and long term analysis on US and European markets, various major FX pairs, commodities from Gold and silver to markets like natural gas.
Daily analysis on where I think the market is going with key support and resistance areas, we move and adjust as the market adjusts.
A chat room where members can discuss ideas with me or other members.
Members get to know who is moving the markets in the S&P pits*
*I have permission to post comments from the audio I hear from the S&P pits.
If you looking for quality analysis from someone that actually looks at multiple charts and works hard at providing members information to stay on the right side of the trends and making $$$, why not give the site a trial.
If any of the readers want to see this article in a PDF format.
Please send an e-mail to Enquires@wavepatterntraders.com
Please put in the header PDF, or make it known that you want to be added to the mailing list for any future articles.
Or if you have any questions about becoming a member, please use the email address above.
If you like what you see, or want to see more of my work, then please sign up for the 4 week trial.
This article is just a small portion of the markets I follow.
I cover many markets, from FX to US equities, right the way through to commodities.
If I have the data I am more than willing to offer requests to members.
Currently new members can sign up for a 4 week free trial to test drive the site, and see if my work can help in your trading and if it meets your requirements.
If you don't like what you see, then drop me an email within the 1st 4 weeks from when you join, and ask for a no questions refund.
You simply have nothing to lose.
By Jason Soni AKA Nouf
© 2018 Copyright Jason Soni AKA Nouf - All Rights Reserved
Disclaimer: The above is a matter of opinion provided for general information purposes only and is not intended as investment advice. Information and analysis above are derived from sources and utilising methods believed to be reliable, but we cannot accept responsibility for any losses you may incur as a result of this analysis. Individuals should consult with their personal financial advisors.
© 2005-2022 http://www.MarketOracle.co.uk - The Market Oracle is a FREE Daily Financial Markets Analysis & Forecasting online publication.