


US Economy Will Deteriorate Over Next Half Year. What this Means for Stocks
Stock-Markets / Stock Markets 2018 Dec 07, 2018 - 11:31 AM GMTBy: Troy_Bombardia

 Today’s post is really important. It’s based on the Macro Investing Model, which is something I’ve been working on for weeks.
The economy (macro) is set to deteriorate
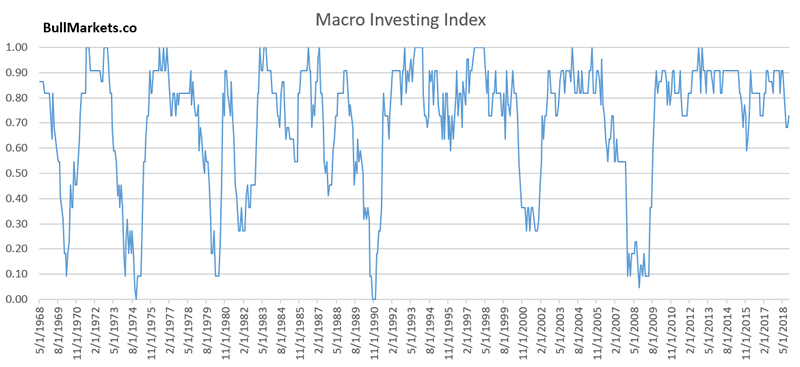
Our new Macro Investing Index is described as:
As we’ve demonstrated repeatedly here at Bull Markets, leading economic indicators are also long term leading indicators for the stock market because the stock market and the economy move in the same direction in the long term. This is how you know if the stock market’s decline is a correction, or the start of a much bigger bear market (e.g. a 30%+ decline).
- A 10-20% decline without significant macro deterioration = a correction. The economy is the dog, and the stock market is the tail. Sooner or later, the dog is going to wag the tail.
- A 10-20% decline with significant macro deterioration = the start of a much bigger decline, possibly 30%+
*This model is updated regularly in the Membership Program. I will not be revealing this model in future blog posts.
And herein lies the problem right now.
Macro deterioration happens all the time. It is a normal part of bull markets. HOWEVER, when “long term risk” is high (i.e. the economy approaches “as good as it gets”), AND macro starts to deteriorate, it tends to cross the line in the sand at which macro cannot return, and the stock market is doomed to be in a bear market.
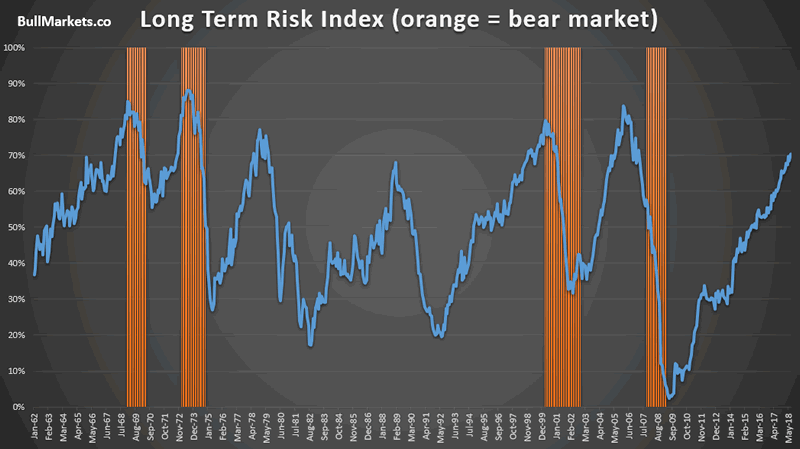
Long Term Risk is “high”
This is our Long Term Risk Index. You can see that it is quite high right now
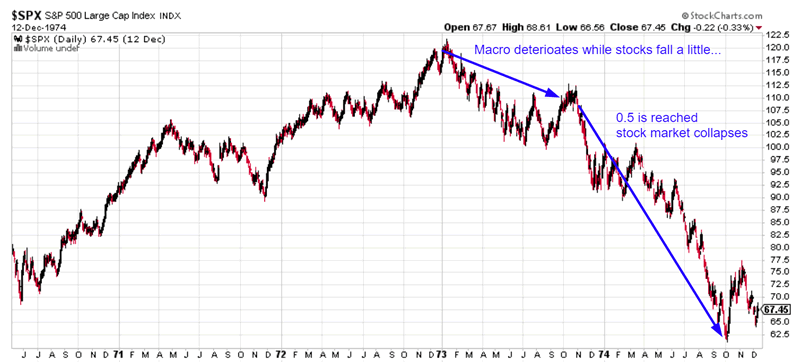
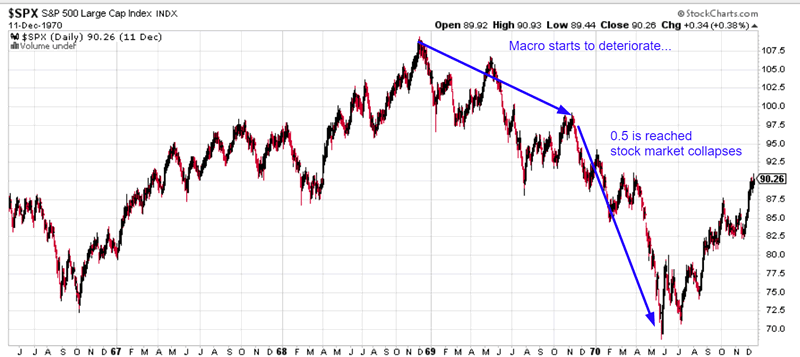
“Line in the sand”
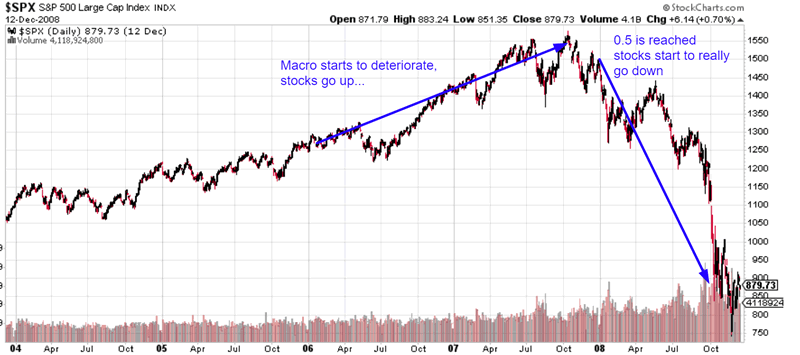
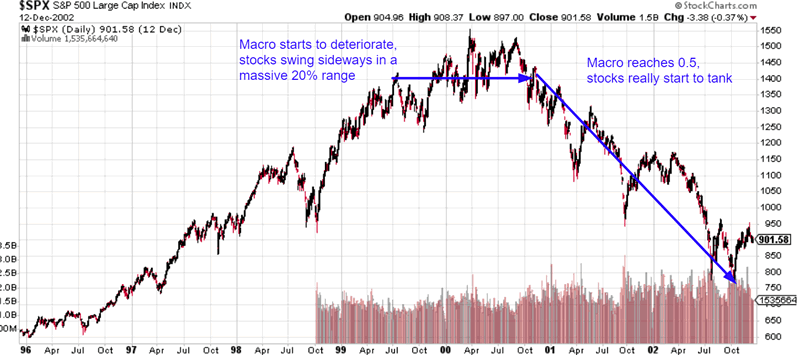
For our Macro Investing Model, 0.5 = the line in the sand. Once the Macro Investing Index falls to 0.5, there is no return, and it becomes long term bearish.
In layman’s terms:
Question: If the market makes a e.g. 15% correction, and then retraces 50-61.8%, how do you know to use that opportunity to sell (in the event that is the one leg up before a much more serious decline/start of a bear market), vs. holding your long position thinking that it is the beginning towards a test of the news?
Answer: look for macro deterioration. Specifically, look for the Macro Investing Index to fall to 0.5. That’s when you know “oh shit, this is the start of a much bigger decline”.
- Right now, long term risk is high, and macro is starting to deteriorate.
- Looking at how the economic data is shaping up right now, it seems that macro will slowly deteriorate over the next 3 months, and then deteriorate more rapidly after that.
- However, macro has not yet crossed the line in the sand, although I think it will do so in Q2 2019.
The recent deterioration in macro (the economy) is something I highlighted back in September 2018, but only recently have had the time to model this. This has not been a long term concern throughout this entire bull market until now, because Long Term Risk has only become high in 2018.
What seperates the current decline from the January-February 2018 correction? In January-February 2018, macro did not deteriorate at all. This time, macro started to deteriorate 1 month before the correction began (in September 2018). That makes the current correction more dangerous than the January-February 2018 correction.
So what does the stock market do when macro deteriorates for the last time in a bull market? (assuming the worst case scenario, that this is the last time?)
- Sometimes the stock market goes down
- Sometimes the stock market swings sideways
- Sometimes the stock market goes up (in a very choppy manner) before going down.
This is because tops are a process, and is impossible to consistently and accurately pick the exact top.
- Sometimes the stock market makes marginal new highs
- Sometimes the market makes a flat top
- Sometimes the stock market makes marginal new lows.
The important thing to note is that the mega-crashes all happened when the Macro Investing Index fell to 0.5. So until the Macro Investing Index reaches 0.5, your downside risk is limited.
*At the current rate, it seems that the Macro Investing Index will reach 0.5 in Q2 2019. This date is is a moving target as new data comes in.

As you can see, in the worst case scenario, the stock market can be down -10% from the all-time high to the last big bounce before the collapse. This is because bear markets give you time to get out. There are multiple big 50-61.8% retracements along the way.
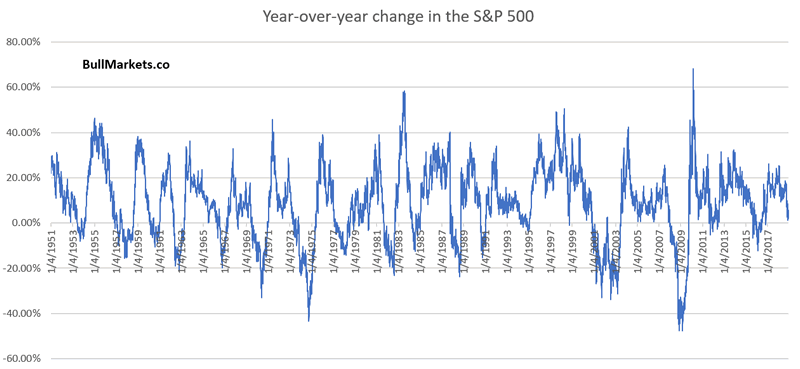
You should be more careful when it comes to turning long term bearish than when it comes to turning long term bullish. This is due to the stock market’s bullish bias. When most people turn long term bearish, the stock market tends to first go up another e.g. 10%, and then it falls 10%. When they say “see, I told you so! I saw it coming!”, the market is no lower than where it was when they first turned long term bearish. Most people who “saw it coming” see it coming way too early, which is no different than someone who sees it coming too late.
This chart demonstrates the year-over-year change in the S&P 500. Notice how it is positive most of the time because of this bullish bias. And despite the stock market’s current correction, it is still not negative right now. That is the long term bullish bias at work.
Changes in market outlook
As a result of this new model (which we will use for future trading), our long term market outlook has changed. Be flexible as the data changes, yet strong enough to stick to your investment/trading system.
- The stock market’s long term direction = “a topping process”. Tops are a process, and not an event. Sometimes tops result in marginal new highs, sometimes tops result in marginal new lows. In other words, it’s impossible to consistently and accurately know if the stock market will make an exact new all-time high. That is why the world’s best investors and traders don’t try to pick exact tops and bottoms.
- But the defining characteristic is that topping processes occur BEFORE the mega-crash, and these topping processes are marked by massive up and down swings in a big range.
- The medium term leans bullish.
I want to make 1 last important point. A lot of professionals are turning long term bearish right now. Just look at CNBC.
Throughout history, professionals would often turn bearish way too early. Back in 1998, all of the world’s best investors (e.g. Jim Rogers, George Soros, Jeremy Grantham) thought that the 20% correction in August – September 1998 was the start of a big bear market. It wasn’t. The stock market rallied for another 1.5 years before topping, even though the rally was very choppy.
Could the stock market be doing the same thing right now? Could this be just a correction that scares everyone, and then goes on to make much higher highs? (i.e. one final melt up)
Up until now, I had no answer. I thought it was possible (the case for one last “melt up”).
But now, I think it’s unlikely. There was no significant macro deterioration in the August – September 1998 correction of -20%. Today, macro deterioration is a little worse. If macro continues to deteriorate over the next several months, then you know that a 1998-2000 last leg of a bull market is unlikely.
And now, let’s get to the technical studies. Although the technical market studies are more popular, the fundamental analysis is far more valuable. No matter how you slice and dice it, all technical indicators have too many false signals. That’s why you need to filter them with fundamental analysis.
Let’s determine the stock market’s most probable direction by objectively quantifying technical analysis. For reference, here’s the random probability of the U.S. stock market going up on any given day, week, or month.

*Probability ≠ certainty. Past performance ≠ future performance. But if you don’t use the past as a guide, you are walking into the future blindly.
Another example that volatility is mean reverting
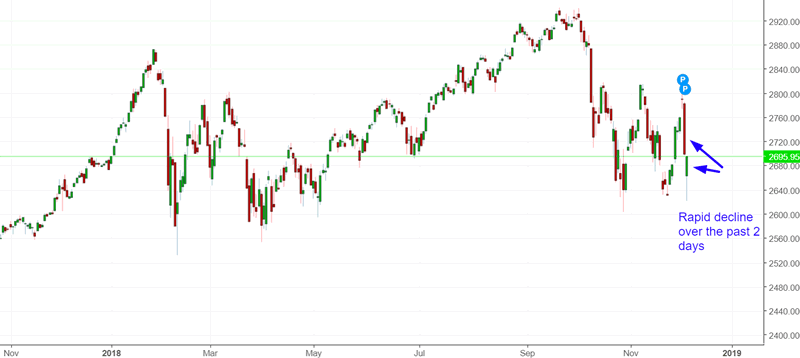
It’s been a pretty crazy 2 days. The S&P 500 dropped rapidly.
Here’s what happened next to the S&P 500 when there were 2 consecutive days inw hich the day’s LOW was more than -2.7% below the previous day’s LOW.
*Data from 1950 – present
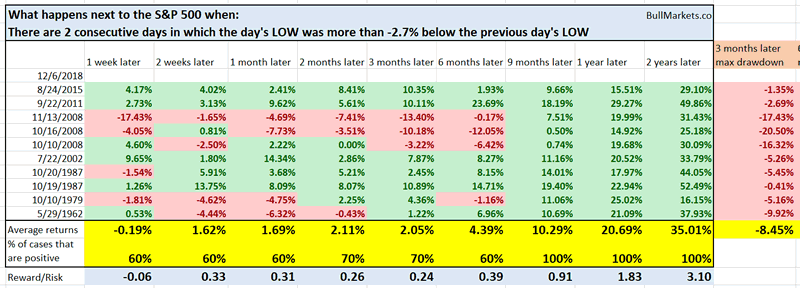
Interestingly enough, the 9 months – 2 year forward returns were excellent. Even if you only look at the bull market cases (e.g. 2015, 2011), the 2 year forward returns were good. This certainly outlines the possibility of 1 last melt-up, although I think it is unlikely.
Intense “buying the dip”
What a wild day. The S&P tanked on the intraday, and then rallied back to almost breakeven on the CLOSE.
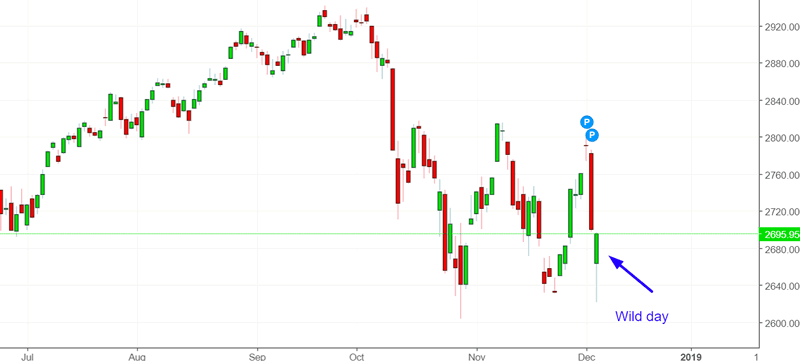
In other words, someone bought the dip like crazy, whether it be humans or algos.
Here’s what happened next to the S&P when its daily LOW was more than -2.5% below yesterday’s LOW, while the CLOSE was within 0.2% of yesterday’s CLOSE.
*Data from 1962 – present
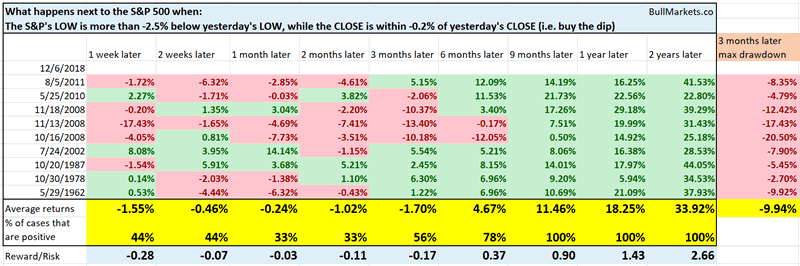
Once again, this outlines the melt-up case. Notice that the medium term bearish cases (e.g. see 2008) occurred after the S&P had crashed 30-40%. So that’s a very different context than today.
Crazy volatility
I feel like a broken record when writing “the stock market has crashed”. That’s because it has gone down on many days over the past 2 months.
In the past 2 months, there have been 4 days in which the S&P’s daily LOW was more than -2% below yesterday’s LOW.
Here’s what happened next (historically), when the S&P 500 was within 10% of a 1 year high.
*Data from 1962 – present
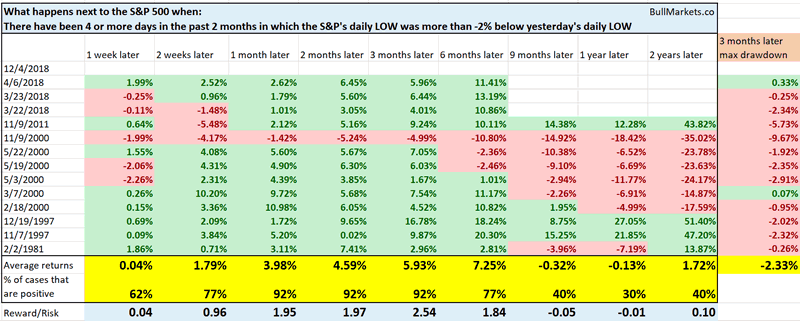
What’s interesting here are the clusters. Notice the cluster of cases in 2000, and the cluster of cases in 2018. A sign of a long term topping process?
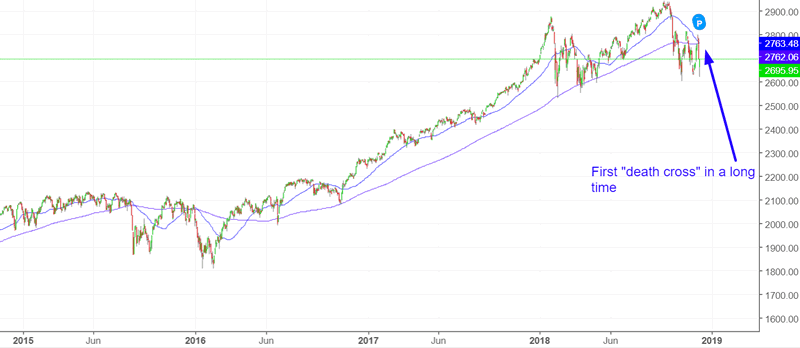
Death cross
The S&P 500 will make a death cross tomorrow, for the first time since early-2016. That is a long time, and demonstrates how strong the S&P’s uptrend has been.
Here’s what happened next to the S&P 500 when the 50 dma fell below the 200 dma for the first time in 2 years
*Data from 1930 – present
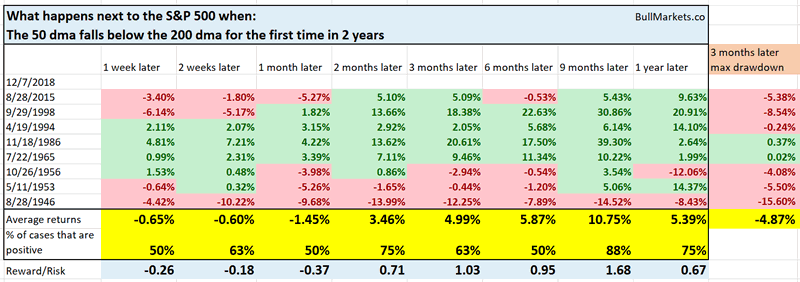
As you can see, this is not consistently bearish for the stock market on any time frame.
Click here to see yesterday’s market study
Conclusion
Here’s what I think will happen based on our discretionary fundamental outlook:
- The U.S. stock market is in a long term topping process. It’s hard to know if there will be an exact new all-time high or not. Some topping processes make slightly lower highs, some topping processes swing sideways in a range, and some topping processes make higher highs. Topping processes can last 6-12 months.
- The medium term direction leans bullish (i.e. trend for the next 6-9 months)
- The short-medium term is mostly a 50-50 bet.
We focus on the medium term and long term. We mostly ignore the short term, which is usually just noise.
Our discretionary market outlook is not a reflection of how we’re trading the markets right now. We trade based on our clear, quantitative trading models, such as the Medium-Long Term Model.
Members can see exactly how we’re trading the U.S. stock market right now based on our trading models.
Click here for more market studies
By Troy Bombardia
I’m Troy Bombardia, the author behind BullMarkets.co. I used to run a hedge fund, but closed it due to a major health scare. I am now enjoying life and simply investing/trading my own account. I focus on long term performance and ignore short term performance.
Copyright 2018 © Troy Bombardia - All Rights Reserved
Disclaimer: The above is a matter of opinion provided for general information purposes only and is not intended as investment advice. Information and analysis above are derived from sources and utilising methods believed to be reliable, but we cannot accept responsibility for any losses you may incur as a result of this analysis. Individuals should consult with their personal financial advisors.
© 2005-2022 http://www.MarketOracle.co.uk - The Market Oracle is a FREE Daily Financial Markets Analysis & Forecasting online publication.